Review
. 2021 Oct:55:101471.
doi: 10.1016/j.cocis.2021.101471. Epub 2021 May 29.

Airborne virus transmission via respiratory droplets: Effects of droplet evaporation and sedimentation

Affiliations
Review

Airborne virus transmission via respiratory droplets: Effects of droplet evaporation and sedimentation

Majid Rezaei et al. Curr Opin Colloid Interface Sci. 2021 Oct.

Abstract

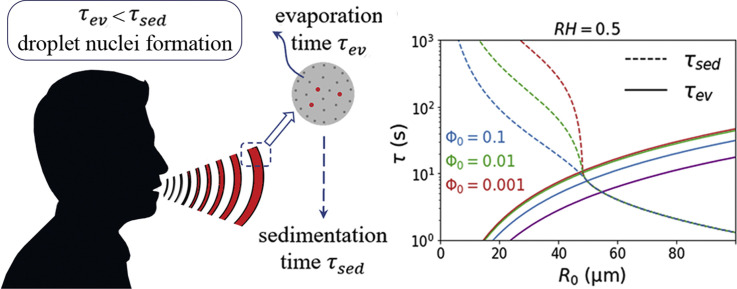
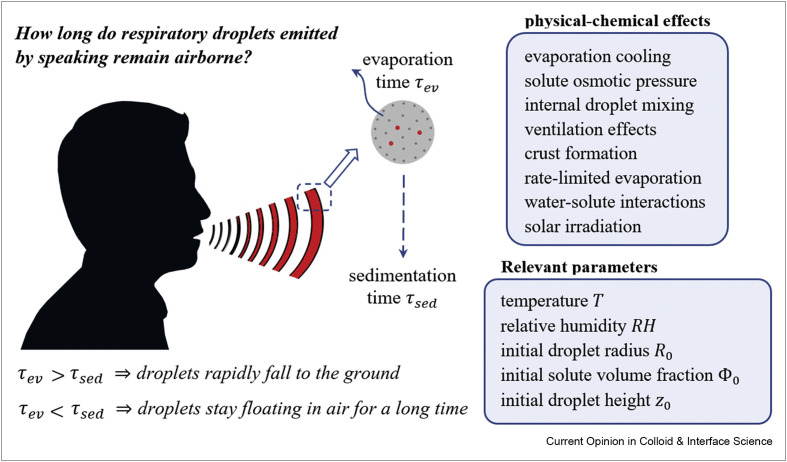
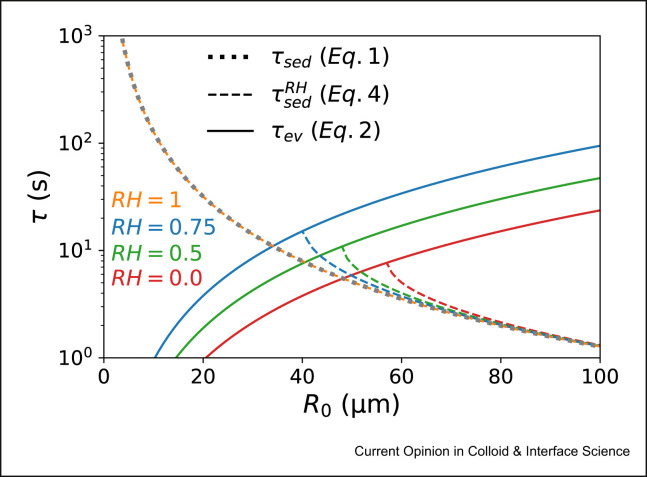
Airborne transmission is considered as an important route for the spread of infectious diseases, such as severe acute respiratory syndrome coronavirus 2 (SARS-CoV-2), and is primarily determined by the droplet sedimentation time, that is, the time droplets spend in air before reaching the ground. Evaporation increases the sedimentation time by reducing the droplet mass. In fact, small droplets can, depending on their solute content, almost completely evaporate during their descent to the ground and remain airborne as so-called droplet nuclei for a long time. Considering that viruses possibly remain infectious in aerosols for hours, droplet nuclei formation can substantially increase the infectious viral air load. Accordingly, the physical-chemical factors that control droplet evaporation and sedimentation times and play important roles in determining the infection risk from airborne respiratory droplets are reviewed in this article.

Keywords: Airborne virus transmission; Droplet evaporation; Droplet nuclei; Droplet sedimentation; Wells model.


Conflict of interest statement

The authors declare that they have no known competing financial interests or personal relationships that could have appeared to influence the work reported in this paper.

Figures

Image 1
Graphical abstract
Figure 1
Figure 1
A main question regarding the airborne transmission of infection is how long human respiratory droplets stay floating in air. To answer this question, the evaporation and sedimentation processes of saliva droplets have to be characterized. If droplets are small enough to completely evaporate to so-called droplet nuclei before they hit the ground, they will remain airborne for hours. Larger droplets, however, fall to the ground in a few seconds. Sedimentation and evaporation times of droplets are controlled by various physical-chemical effects and relevant parameters, which are listed in the diagram.
Figure 2
Figure 2
Evaporation and sedimentation times of pure water droplets as a function of the initial droplet radius R0 for an initial height of z0=1.5m. Results are shown for different relative humidities. Solid and broken lines indicate the evaporation times (Eq. (2)) and the sedimentation times (Eq. (4)), respectively. In the limit of RH=1, no evaporation takes place, and Eq. (4) yields a sedimentation time that equals Eq. (1) (shown by a dotted line), which neglects the evaporation-induced variation of the droplet size. Droplets with initial radii below the critical radius R0crit given by Eq. (5) (which is the initial radius at which the evaporation and sedimentation times are equal) completely evaporate before they hit the ground, and thus, their sedimentation time is infinity.
Figure 3
Figure 3
Variation of the droplet radius R with time t in the presence of nonvolatile solutes according to Eq. (7). The liquid solution is assumed ideal (γ=1), and data are shown for initial droplet radius R0=50μm, relative humidity RH=0.5, and two different initial solute volume fractions of Φ0=103 (main figure) and Φ0=102 (inset). The y-axis is rescaled by Rev, the equilibrium radius of the droplet at the end of the evaporation process (Eq. (6)). Solid and dashed lines indicate the results considering and neglecting the effect of the solute-induced water vapor-pressure reduction (which is reflected by the logarithmic term in Eq. (7)), respectively.
Figure 4
Figure 4
Evaporation and sedimentation times as a function of the initial radius R0 in the presence of nonvolatile solutes, for an initial height of z0=1.5m. Panel (a) shows results for a fixed initial solute volume fraction Φ0=0.01 and different relative humidities. Panel (b) shows results for a fixed relative humidity RH=0.5 and different initial solute volume fractions. Solid and broken lines indicate the evaporation and sedimentation times, which are obtained from Eqs. (8), (9), respectively. For Φ0=0.01 and RH=0.99, and Φ0=0.5 and RH=0.5, no evaporation takes place, and Eq. (9) recovers the result of Eq. (1) (shown by dotted lines).
Figure 5
Figure 5
Evaporation time as a function of the initial solute volume fraction Φ0. The liquid solution is assumed ideal (γ=1), and the initial droplet radius is R0=50μm. Panel (a) shows results for different relative humidities. Solid lines indicate results from Eq. (11), which accounts for the solute-induced water vapor-pressure reduction, the presence of internal concentration and diffusivity profiles, and the solute-concentration dependence of evaporation cooling. Dashed lines show the results from Eq. (10), which neglects the presence of internal concentration and diffusivity profiles and the solute-concentration dependence of evaporation cooling, but accounts for the solute-induced water vapor-pressure reduction. Dotted lines indicate the results from Eq. (8), in which the water vapor-pressure reduction is also neglected. Panel (b) shows the evaporation times estimated from Eq. (11) (solid line) along with those obtained from numerical solutions of the heat-conduction and water-diffusion equations for fixed relative humidity RH=0.75. Open squares indicate results that account for the solute-induced water vapor-pressure reduction, the presence of internal concentration and diffusivity profiles, the solute-concentration dependence of evaporation cooling, and the dependence of the water diffusivity on the local solute concentration profile. Downward triangles are obtained for infinitely rapid water diffusion in the droplet Dwsol (i.e. neglecting internal water concentration gradients), filled circles are obtained for a constant but finite water diffusivity inside the droplet, and upward triangles are obtained for a constant finite water diffusivity inside the droplet and additionally neglecting the solute-concentration dependence of the evaporation cooling effect by setting θsol=θ (Eq. (3)) in numerical calculations.

Similar articles

Cited by

References

    1. Wells W.F. ON air-borne infection∗: study II. Droplets and droplet nuclei. Am J Epidemiol. 1934;20:611–618.
    1. Leung Nancy H.L., Chu Daniel K.W., Shiu Eunice Y.C., Chan Kwok-Hung, McDevitt James J., Hau Benien J.P., Yen Hui-Ling, Li Yuguo, Ip Dennis K.M., Malik Peiris JS, Seto Wing-Hong, Leung Gabriel M., Milton Donald K., Cowling Benjamin J. Respiratory virus shedding in exhaled breath and efficacy of face masks. Nat Med. 2020;26:676–680. - PMC - PubMed
    1. Schulman J.L., Kilbourne E.D. Experimental transmission OF influenza virus infection IN mice. II. Some factors affecting the incidence OF transmitted infection. J Exp Med. 1963;118:267–275. - PMC - PubMed
    1. Bridges C., Kuehnert M., Hall C. Transmission of influenza: implications for control in health care settings. Clin Infect Dis. 2003;37:1094–1101. - PubMed
    1. Klompas M., Baker M., Rhee C. Airborne transmission of SARS-CoV-2: theoretical considerations and available evidence. J Am Med Assoc. 2020;324 - PubMed

LinkOut - more resources