

Effects of Genetic Polymorphism in CYP2D6, CYP2C19, and the Organic Cation Transporter OCT1 on Amitriptyline Pharmacokinetics in Healthy Volunteers and Depressive Disorder Patients
- PMID: 34093211
- PMCID: PMC8175851
- DOI: 10.3389/fphar.2021.688950
Effects of Genetic Polymorphism in CYP2D6, CYP2C19, and the Organic Cation Transporter OCT1 on Amitriptyline Pharmacokinetics in Healthy Volunteers and Depressive Disorder Patients
Abstract
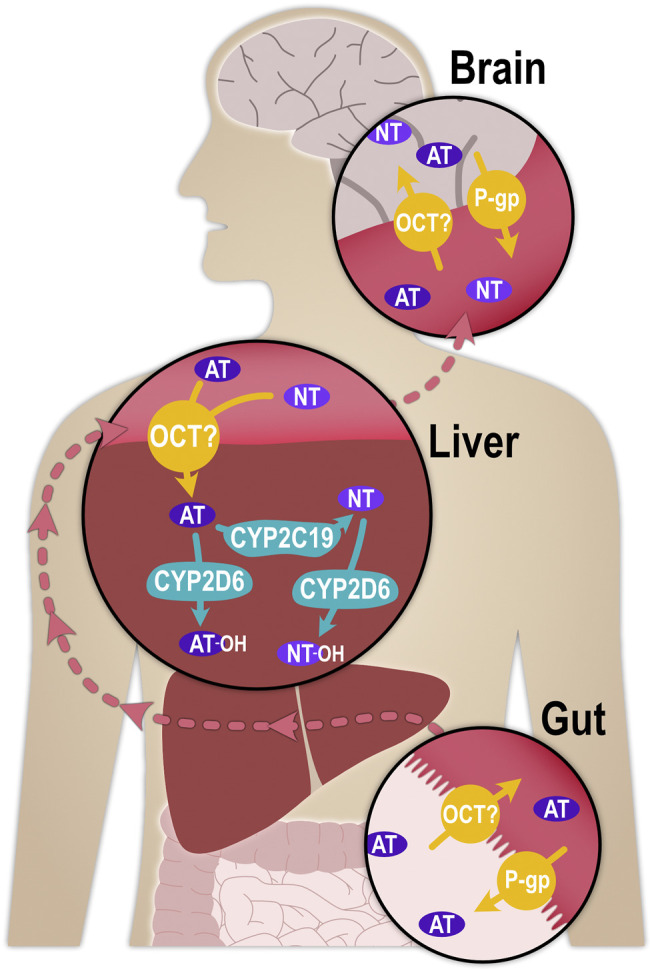
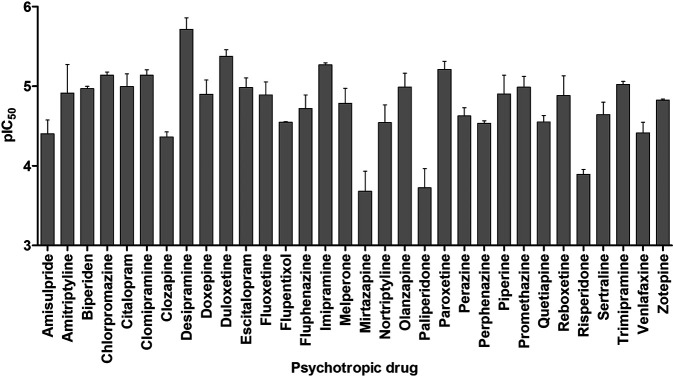
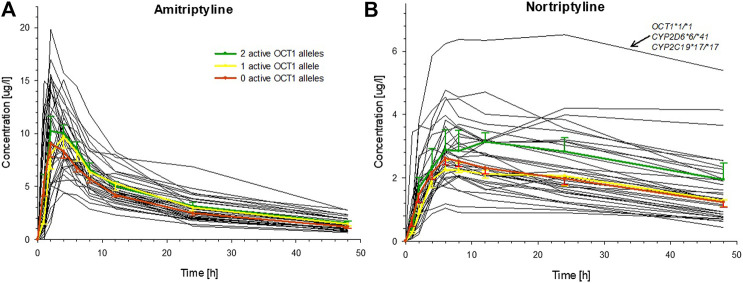
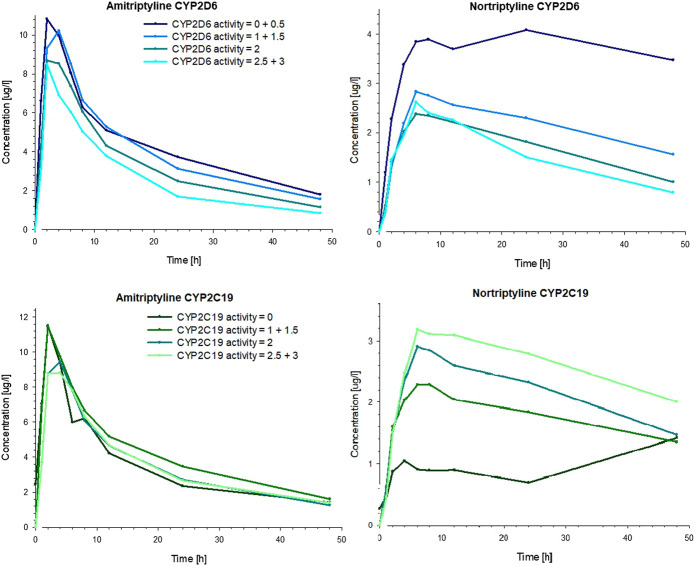
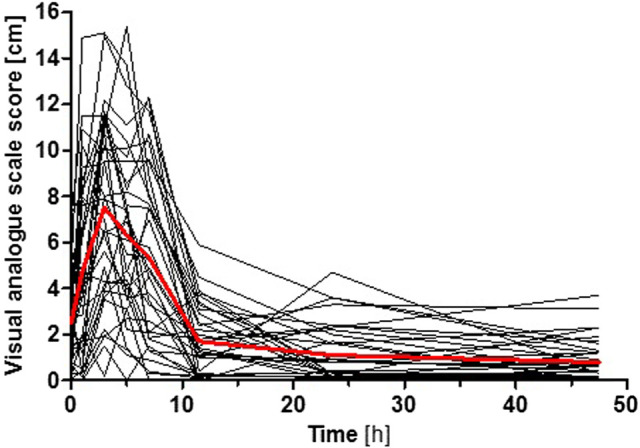
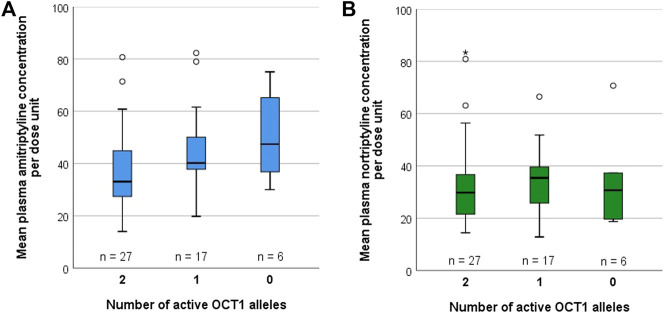
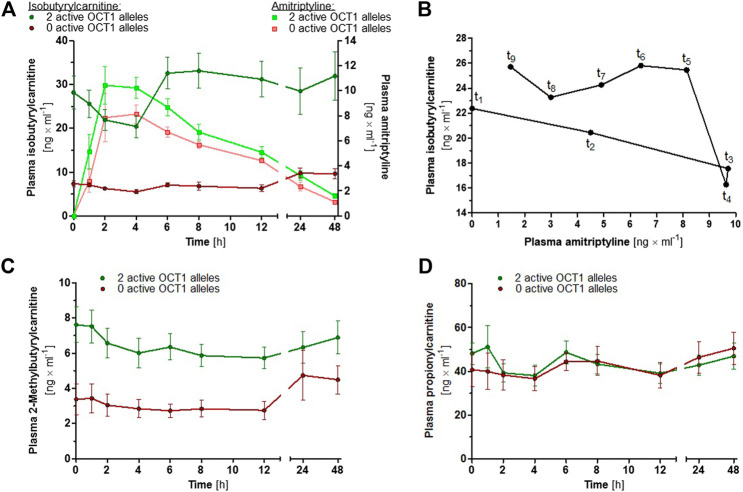
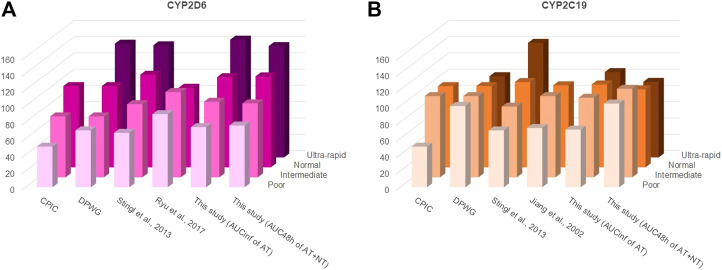
The tricyclic antidepressant amitriptyline is frequently prescribed but its use is limited by its narrow therapeutic range and large variation in pharmacokinetics. Apart from interindividual differences in the activity of the metabolising enzymes cytochrome P450 (CYP) 2D6 and 2C19, genetic polymorphism of the hepatic influx transporter organic cation transporter 1 (OCT1) could be contributing to interindividual variation in pharmacokinetics. Here, the impact of OCT1 genetic variation on the pharmacokinetics of amitriptyline and its active metabolite nortriptyline was studied in vitro as well as in healthy volunteers and in depressive disorder patients. Amitriptyline and nortriptyline were found to inhibit OCT1 in recombinant cells with IC50 values of 28.6 and 40.4 µM. Thirty other antidepressant and neuroleptic drugs were also found to be moderate to strong OCT1 inhibitors with IC50 values in the micromolar range. However, in 35 healthy volunteers, preselected for their OCT1 genotypes, who received a single dose of 25 mg amitriptyline, no significant effects on amitriptyline and nortriptyline pharmacokinetics could be attributed to OCT1 genetic polymorphism. In contrast, the strong impact of the CYP2D6 genotype on amitriptyline and nortriptyline pharmacokinetics and of the CYP2C19 genotype on nortriptyline was confirmed. In addition, acylcarnitine derivatives were measured as endogenous biomarkers for OCT1 activity. The mean plasma concentrations of isobutyrylcarnitine and 2-methylbutyrylcarnitine were higher in participants with two active OCT1 alleles compared to those with zero OCT1 activity, further supporting their role as endogenous in vivo biomarkers for OCT1 activity. A moderate reduction in plasma isobutyrylcarnitine concentrations occurred at the time points at which amitriptyline plasma concentrations were the highest. In a second, independent study sample of 50 patients who underwent amitriptyline therapy of 75 mg twice daily, a significant trend of increasing amitriptyline plasma concentrations with decreasing OCT1 activity was observed (p = 0.018), while nortriptyline plasma concentrations were unaffected by the OCT1 genotype. Altogether, this comprehensive study showed that OCT1 activity does not appear to be a major factor determining amitriptyline and nortriptyline pharmacokinetics and that hepatic uptake occurs mainly through other mechanisms.
Keywords: CYP2C19; CYP2D6; OCT1; SLC22A1; amitriptyline; drug transport; nortriptyline; organic cation transporter 1.
Copyright © 2021 Matthaei, Brockmöller, Steimer, Pischa, Leucht, Kullmann, Jensen, Ouethy, Tzvetkov and Rafehi.
Conflict of interest statement
The authors declare that the research was conducted in the absence of any commercial or financial relationships that could be construed as a potential conflict of interest.
Figures
Similar articles
-
Quantitative Modeling Analysis Demonstrates the Impact of CYP2C19 and CYP2D6 Genetic Polymorphisms on the Pharmacokinetics of Amitriptyline and Its Metabolite, Nortriptyline.J Clin Pharmacol. 2019 Apr;59(4):532-540. doi: 10.1002/jcph.1344. Epub 2018 Nov 19. J Clin Pharmacol. 2019. PMID: 30452773
-
A Study on CYP2C19 and CYP2D6 Polymorphic Effects on Pharmacokinetics and Pharmacodynamics of Amitriptyline in Healthy Koreans.Clin Transl Sci. 2017 Mar;10(2):93-101. doi: 10.1111/cts.12451. Epub 2017 Mar 14. Clin Transl Sci. 2017. PMID: 28296334 Free PMC article. Clinical Trial.
-
Isobutyrylcarnitine as a Biomarker of OCT1 Activity and Interspecies Differences in its Membrane Transport.Front Pharmacol. 2021 May 10;12:674559. doi: 10.3389/fphar.2021.674559. eCollection 2021. Front Pharmacol. 2021. PMID: 34040533 Free PMC article.
-
OCT1 pharmacogenetics in pain management: is a clinical application within reach?Pharmacogenomics. 2017 Nov;18(16):1515-1523. doi: 10.2217/pgs-2017-0095. Epub 2017 Oct 24. Pharmacogenomics. 2017. PMID: 29061087 Review.
-
Expression of organic cation transporter 1 (OCT1): unique patterns of indirect regulation by nuclear receptors and hepatospecific gene regulation.Drug Metab Rev. 2016 May;48(2):139-58. doi: 10.1080/03602532.2016.1188936. Epub 2016 Jun 9. Drug Metab Rev. 2016. PMID: 27278216 Review.
Cited by
-
The Effects of CYP2C19 Genotype on Proxies of SSRI Antidepressant Response in the UK Biobank.Pharmaceuticals (Basel). 2023 Sep 11;16(9):1277. doi: 10.3390/ph16091277. Pharmaceuticals (Basel). 2023. PMID: 37765085 Free PMC article.
-
ABCB1, SLC22A1, COMT, and OPRM1 genotypes: Study of their influence on plasma methadone levels and clinical response to methadone maintenance treatment in opioid use disorder.Fundam Clin Pharmacol. 2025 Jun;39(3):e70013. doi: 10.1111/fcp.70013. Fundam Clin Pharmacol. 2025. PMID: 40346879 Free PMC article.
-
The big data challenge - and how polypharmacology supports the translation from pre-clinical research into clinical use against neurodegenerative diseases and beyond.Neural Regen Res. 2024 Aug 1;19(8):1647-1648. doi: 10.4103/1673-5374.387984. Epub 2023 Nov 8. Neural Regen Res. 2024. PMID: 38103223 Free PMC article. No abstract available.
-
Emerging Roles of the Human Solute Carrier 22 Family.Drug Metab Dispos. 2021 Dec 17;50(9):1193-210. doi: 10.1124/dmd.121.000702. Drug Metab Dispos. 2021. PMID: 34921098 Free PMC article.
-
From genes to drugs: CYP2C19 and pharmacogenetics in clinical practice.Front Pharmacol. 2024 Feb 14;15:1326776. doi: 10.3389/fphar.2024.1326776. eCollection 2024. Front Pharmacol. 2024. PMID: 38420192 Free PMC article. Review.
References
-
- Adams S. H., Hoppel C. L., Lok K. H., Zhao L., Wong S. W., Minkler P. E., et al. (2009). Plasma Acylcarnitine Profiles Suggest Incomplete Long-Chain Fatty Acid β-Oxidation and Altered Tricarboxylic Acid Cycle Activity in Type 2 Diabetic African-American Women. J. Nutr. 139, 1073–1081. 10.3945/jn.108.103754 - DOI - PMC - PubMed
-
- Baumann P., Jonzier-Perey M., Koeb L., KüPfer A., Tinguely D., SchöPf J. (1986). Amitriptyline Pharmacokinetics and Clinical Response: II. Metabolic Polymorphism Assessed by Hydroxylation of Debrisoquine and Mephenytoin. Int. Clin. Psychopharmacol. 1, 102–112. 10.1097/00004850-198604000-00002 - DOI - PubMed
LinkOut - more resources
Full Text Sources