

Liver Transcriptome Dynamics During Hibernation Are Shaped by a Shifting Balance Between Transcription and RNA Stability
- PMID: 34093224
- PMCID: PMC8176218
- DOI: 10.3389/fphys.2021.662132
Liver Transcriptome Dynamics During Hibernation Are Shaped by a Shifting Balance Between Transcription and RNA Stability
Abstract
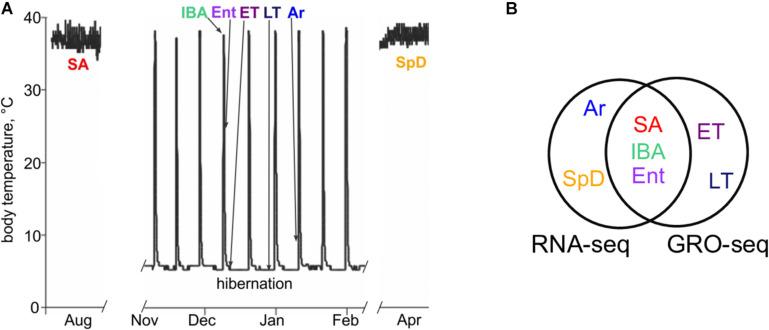
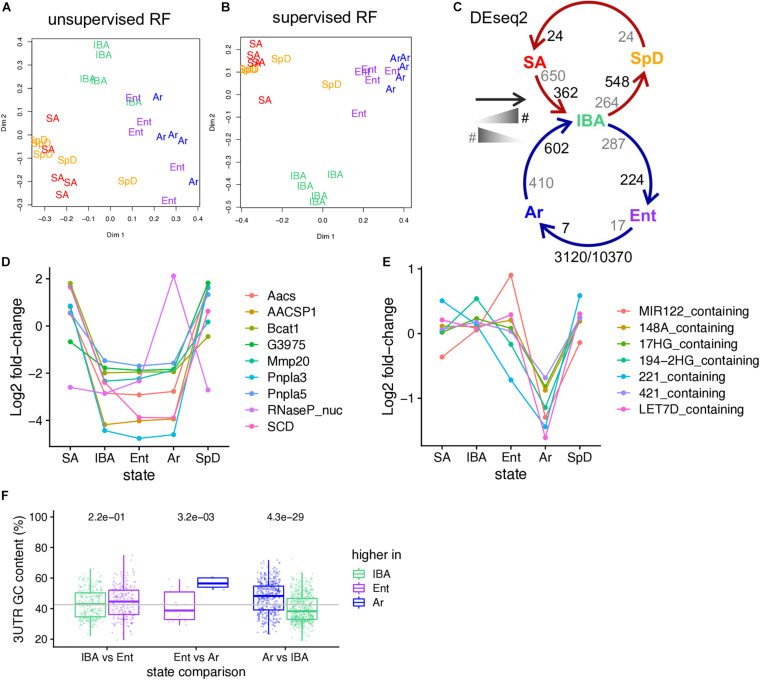
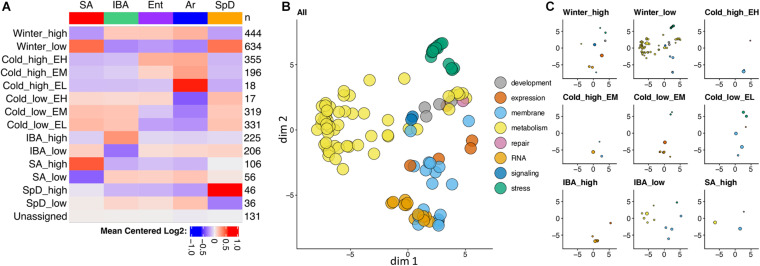
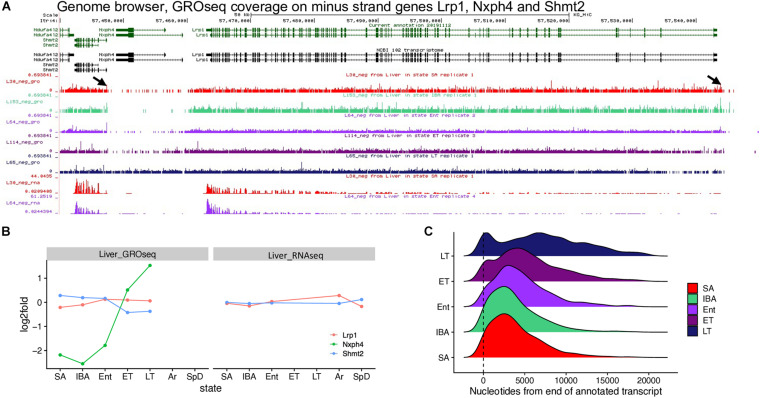
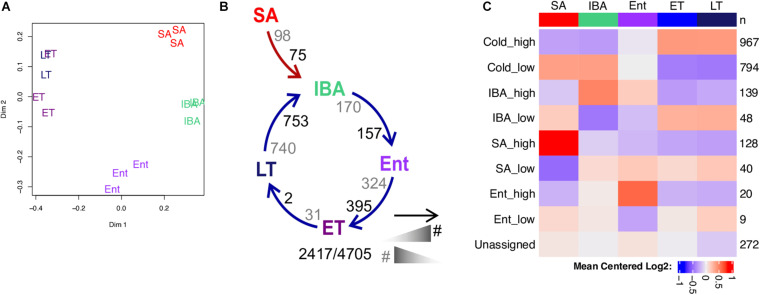
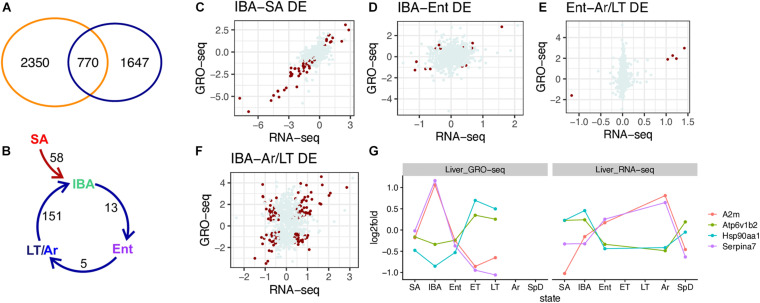
Hibernators dramatically lower metabolism to save energy while fasting for months. Prolonged fasting challenges metabolic homeostasis, yet small-bodied hibernators emerge each spring ready to resume all aspects of active life, including immediate reproduction. The liver is the body's metabolic hub, processing and detoxifying macromolecules to provide essential fuels to brain, muscle and other organs throughout the body. Here we quantify changes in liver gene expression across several distinct physiological states of hibernation in 13-lined ground squirrels, using RNA-seq to measure the steady-state transcriptome and GRO-seq to measure transcription for the first time in a hibernator. Our data capture key timepoints in both the seasonal and torpor-arousal cycles of hibernation. Strong positive correlation between transcription and the transcriptome indicates that transcriptional control dominates the known seasonal reprogramming of metabolic gene expression in liver for hibernation. During the torpor-arousal cycle, however, discordance develops between transcription and the steady-state transcriptome by at least two mechanisms: 1) although not transcribed during torpor, some transcripts are unusually stable across the torpor bout; and 2) unexpectedly, on some genes, our data suggest continuing, slow elongation with a failure to terminate transcription across the torpor bout. While the steady-state RNAs corresponding to these read through transcripts did not increase during torpor, they did increase shortly after rewarming despite their simultaneously low transcription. Both of these mechanisms would assure the immediate availability of functional transcripts upon rewarming. Integration of transcriptional, post-transcriptional and RNA stability control mechanisms, all demonstrated in these data, likely initiate a serial gene expression program across the short euthermic period that restores the tissue and prepares the animal for the next bout of torpor.
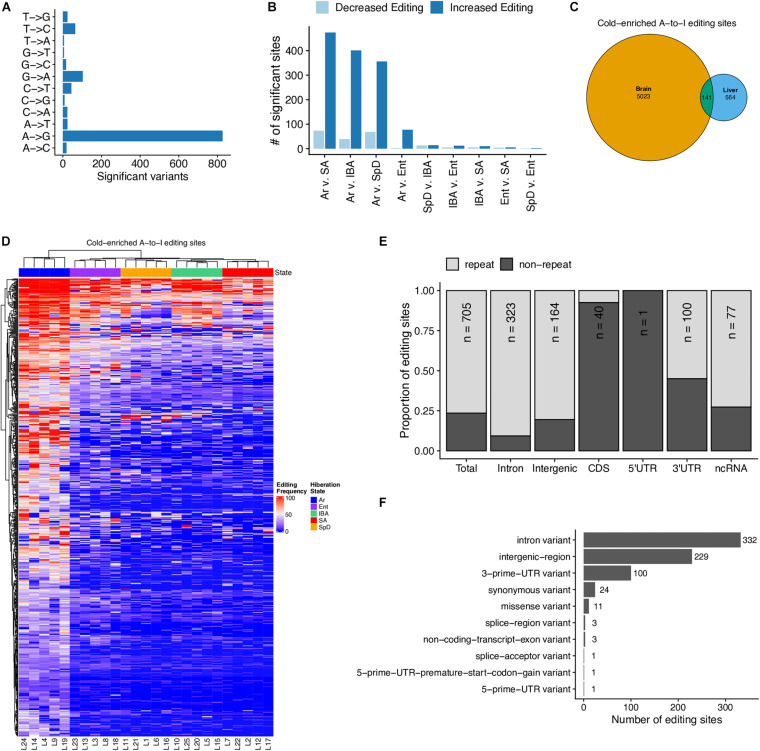
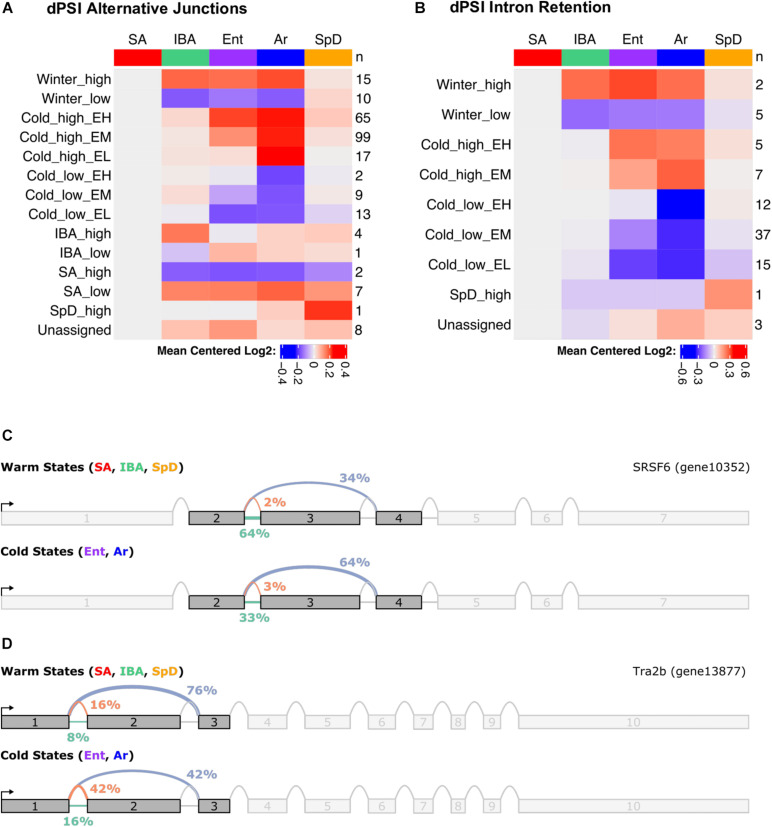
Keywords: A-to-I RNA editing; ARE-binding proteins; Ictidomys tridecemlineatus; alternative splicing; hepatocyte.
Copyright © 2021 Gillen, Fu, Riemondy, Jager, Fang, Lazar and Martin.
Conflict of interest statement
The authors declare that the research was conducted in the absence of any commercial or financial relationships that could be construed as a potential conflict of interest.
Figures
Similar articles
-
Adrenal gene expression dynamics support hibernation in 13-lined ground squirrels.Physiol Genomics. 2023 Apr 1;55(4):155-167. doi: 10.1152/physiolgenomics.00162.2022. Epub 2023 Feb 27. Physiol Genomics. 2023. PMID: 36847440
-
Mitochondrial microRNA profiles are altered in thirteen-lined ground squirrels (Ictidomys tridecemlineatus) during hibernation.Physiol Genomics. 2024 Aug 1;56(8):555-566. doi: 10.1152/physiolgenomics.00017.2024. Epub 2024 Jun 17. Physiol Genomics. 2024. PMID: 38881427
-
Metabolic changes associated with the long winter fast dominate the liver proteome in 13-lined ground squirrels.Physiol Genomics. 2014 May 15;46(10):348-61. doi: 10.1152/physiolgenomics.00190.2013. Epub 2014 Mar 18. Physiol Genomics. 2014. PMID: 24642758 Free PMC article.
-
Annual lipid cycles in hibernators: integration of physiology and behavior.Annu Rev Nutr. 2005;25:469-97. doi: 10.1146/annurev.nutr.25.050304.092514. Annu Rev Nutr. 2005. PMID: 16011475 Review.
-
Seasonal Expression of Avian and Mammalian Daily Torpor and Hibernation: Not a Simple Summer-Winter Affair†.Front Physiol. 2020 May 20;11:436. doi: 10.3389/fphys.2020.00436. eCollection 2020. Front Physiol. 2020. PMID: 32508673 Free PMC article. Review.
Cited by
-
Mitochondrial polymorphism m.3017C>T of SHLP6 relates to heterothermy.Front Physiol. 2023 Aug 21;14:1207620. doi: 10.3389/fphys.2023.1207620. eCollection 2023. Front Physiol. 2023. PMID: 37675281 Free PMC article.
-
Impacts of seasonality on gene expression in the Chinese horseshoe bat.Ecol Evol. 2022 May 13;12(5):e8923. doi: 10.1002/ece3.8923. eCollection 2022 May. Ecol Evol. 2022. PMID: 35592062 Free PMC article.
-
Multiple time points of transcriptome analysis revealed altered genes involved in maintaining hibernation in the hypothalamus of Tamias sibiricus.Front Neurosci. 2024 Dec 23;18:1501223. doi: 10.3389/fnins.2024.1501223. eCollection 2024. Front Neurosci. 2024. PMID: 39764389 Free PMC article.
-
Cold resistance of mammalian hibernators ∼ a matter of ferroptosis?Front Physiol. 2024 Apr 25;15:1377986. doi: 10.3389/fphys.2024.1377986. eCollection 2024. Front Physiol. 2024. PMID: 38725569 Free PMC article. Review.
-
Elevated plasma phospholipid n-3 docosapentaenoic acid concentrations during hibernation.PLoS One. 2023 Jun 9;18(6):e0285782. doi: 10.1371/journal.pone.0285782. eCollection 2023. PLoS One. 2023. PMID: 37294822 Free PMC article.
References
-
- Bogren L. K., Grabek K. R., Barsh G. S., Martin S. L. (2017). Comparative tissue transcriptomics highlights dynamic differences among tissues but conserved metabolic transcript prioritization in preparation for arousal from torpor. J. Comp. Physiol. B 187 735–748. 10.1007/s00360-017-1073-x - DOI - PubMed
-
- Breiman L. (2001). Random forests. Mach. Learn. 45 5–32.
Grants and funding
LinkOut - more resources
Full Text Sources
Molecular Biology Databases