

Prefrontal Functional Connectivity During the Verbal Fluency Task in Patients With Major Depressive Disorder: A Functional Near-Infrared Spectroscopy Study
- PMID: 34093276
- PMCID: PMC8175962
- DOI: 10.3389/fpsyt.2021.659814
Prefrontal Functional Connectivity During the Verbal Fluency Task in Patients With Major Depressive Disorder: A Functional Near-Infrared Spectroscopy Study
Abstract
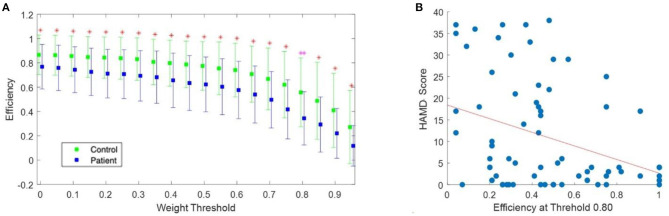
Deviations in activation patterns and functional connectivity have been observed in patients with major depressive disorder (MDD) with prefrontal hemodynamics of patients compared with healthy individuals. The graph-theoretical approach provides useful network metrics for evaluating functional connectivity. The evaluation of functional connectivity during a cognitive task can be used to explain the neurocognitive mechanism underlying the cognitive impairments caused by depression. Overall, 31 patients with MDD and 43 healthy individuals completed a verbal fluency task (VFT) while wearing a head-mounted functional near-infrared spectroscopy (fNIRS) devices. Hemodynamics and functional connectivity across eight prefrontal subregions in the two groups were analyzed and compared. We observed a reduction in prefrontal activation and weaker overall and interhemispheric subregion-wise correlations in the patient group compared with corresponding values in the control group. Moreover, efficiency, the network measure related to the effectiveness of information transfer, showed a significant between-group difference [t (71.64) = 3.66, corrected p < 0.001] along with a strong negative correlation with depression severity (rho = -0.30, p = 0.009). The patterns of prefrontal functional connectivity differed significantly between the patient and control groups during the VFT. Network measures can quantitatively characterize the reduction in functional connectivity caused by depression. The efficiency of the functional network may play an important role in the understanding of depressive symptoms.
Keywords: efficiency; fNIRS; functional connectivity; major depressive disorder; verbal fluency task.
Copyright © 2021 Dong, Choi, Park, Baik, Jung, Kim and Lee.
Conflict of interest statement
JC is the inventor of continuous-wave near infrared spectroscopy technology, licensed to KAIST's spin-off company OBELAB, which focuses on non-invasive, optical brain imaging. The remaining authors declare that the research was conducted in the absence of any commercial or financial relationships that could be construed as potential conflicts of interest.
Figures
Similar articles
-
Functional near-infrared spectroscopy (fNIRS) in patients with major depressive disorder, generalized anxiety disorder and their comorbidity: Comparison with healthy controls.Asian J Psychiatr. 2025 Mar;105:104382. doi: 10.1016/j.ajp.2025.104382. Epub 2025 Feb 7. Asian J Psychiatr. 2025. PMID: 39933260
-
Insomniacs show greater prefrontal activation during verbal fluency task compared to non-insomniacs: a functional near-infrared spectroscopy investigation of depression in patients.BMC Psychiatry. 2023 Mar 30;23(1):217. doi: 10.1186/s12888-023-04694-z. BMC Psychiatry. 2023. PMID: 36997897 Free PMC article.
-
Neurological activation during verbal fluency task and resting-state functional connectivity abnormalities in obsessive-compulsive disorder: a functional near-infrared spectroscopy study.Front Psychiatry. 2024 Aug 30;15:1416810. doi: 10.3389/fpsyt.2024.1416810. eCollection 2024. Front Psychiatry. 2024. PMID: 39279815 Free PMC article.
-
A scoping review of utilization of the verbal fluency task in Chinese and Japanese clinical settings with near-infrared spectroscopy.Front Psychiatry. 2024 Mar 8;15:1282546. doi: 10.3389/fpsyt.2024.1282546. eCollection 2024. Front Psychiatry. 2024. PMID: 38525251 Free PMC article.
-
Diagnostic and Predictive Applications of Functional Near-Infrared Spectroscopy for Major Depressive Disorder: A Systematic Review.Front Psychiatry. 2020 May 6;11:378. doi: 10.3389/fpsyt.2020.00378. eCollection 2020. Front Psychiatry. 2020. PMID: 32477179 Free PMC article.
Cited by
-
Cortical activation for adolescent-onset minor depression and major depressive disorder: an fNIRS study.Ann Gen Psychiatry. 2024 May 9;23(1):17. doi: 10.1186/s12991-024-00500-6. Ann Gen Psychiatry. 2024. PMID: 38724998 Free PMC article.
-
Effects of Acupuncture on Cortical Activation in Patients with Disorders of Consciousness: A Functional Near-Infrared Spectroscopy Study.Evid Based Complement Alternat Med. 2022 Jul 14;2022:5711961. doi: 10.1155/2022/5711961. eCollection 2022. Evid Based Complement Alternat Med. 2022. PMID: 35958938 Free PMC article.
-
Differentiating people with schizophrenia from healthy controls in a developing Country: An evaluation of portable functional near infrared spectroscopy (fNIRS) as an adjunct diagnostic tool.Front Psychiatry. 2023 Jan 26;14:1061284. doi: 10.3389/fpsyt.2023.1061284. eCollection 2023. Front Psychiatry. 2023. PMID: 36778640 Free PMC article.
-
Functional near-infrared spectroscopy-based diagnosis support system for distinguishing between mild and severe depression using machine learning approaches.Neurophotonics. 2024 Apr;11(2):025001. doi: 10.1117/1.NPh.11.2.025001. Epub 2024 Apr 24. Neurophotonics. 2024. PMID: 38660382 Free PMC article.
-
Predicting outcomes in patients with sepsis-associated encephalopathy using prefrontal functional connectivity analysis.Sci Rep. 2025 May 23;15(1):18040. doi: 10.1038/s41598-025-02658-9. Sci Rep. 2025. PMID: 40410353 Free PMC article.
References
-
- Grimm S, Beck J, Schuepbach D, Hell D, Boesiger P, Bermpohl F, et al. . Imbalance between left and right dorsolateral prefrontal cortex in major depression is linked to negative emotional judgment: an fMRI study in severe major depressive disorder. Biol Psychiatry. (2008) 63:369–76. 10.1016/j.biopsych.2007.05.033 - DOI - PubMed
LinkOut - more resources
Full Text Sources