Development of an Immune-Related Prognostic Index Associated With Glioblastoma
- PMID: 34093386
- PMCID: PMC8172186
- DOI: 10.3389/fneur.2021.610797
Development of an Immune-Related Prognostic Index Associated With Glioblastoma
Abstract
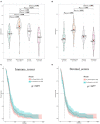
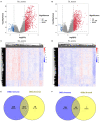
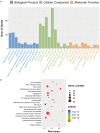
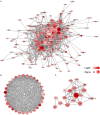
Background: Although the tumor microenvironment (TME) is known to influence the prognosis of glioblastoma (GBM), the underlying mechanisms are not clear. This study aims to identify hub genes in the TME that affect the prognosis of GBM. Methods: The transcriptome profiles of the central nervous systems of GBM patients were downloaded from The Cancer Genome Atlas (TCGA). The ESTIMATE scoring algorithm was used to calculate immune and stromal scores. The application of these scores in histology classification was tested. Univariate Cox regression analysis was conducted to identify genes with prognostic value. Subsequently, functional enrichment analysis and protein-protein interaction (PPI) network analysis were performed to reveal the pathways and biological functions associated with the genes. Next, these prognosis genes were validated in an independent GBM cohort from the Chinese Glioma Genome Atlas (CGGA). Finally, the efficacy of current antitumor drugs targeting these genes against glioma was evaluated. Results: Gene expression profiles and clinical data of 309 GBM samples were obtained from TCGA database. Higher immune and stromal scores were found to be significantly correlated with tissue type and poor overall survival (OS) (p = 0.15 and 0.77, respectively). Functional enrichment analysis identified 860 upregulated and 162 downregulated cross genes, which were mainly linked to immune response, inflammatory response, cell membrane, and receptor activity. Survival analysis identified 228 differentially expressed genes associated with the prognosis of GBM (p ≤ 0.05). A total of 48 hub genes were identified by the Cytoscape tool, and pathway enrichment analysis of the genes was performed using Database for Annotation, Visualization and Integrated Discovery (DAVID). The 228 genes were validated in an independent GBM cohort from the CGGA. In total, 10 genes were found to be significantly associated with prognosis of GBM. Finally, 14 antitumor drugs were identified by drug-gene interaction analysis. Conclusions: Here, 10 TME-related genes and 14 corresponding antitumor agents were found to be associated with the prognosis and OS of GBM.
Keywords: CGGA; TCGA; drugs; glioblastoma; immune scores; overall survival; tumor microenvironment.
Copyright © 2021 Jiang, Shi, Zhao, Zhang, Xie, Zhang, Tan and Wang.
Conflict of interest statement
The authors declare that the research was conducted in the absence of any commercial or financial relationships that could be construed as a potential conflict of interest.
Figures



Similar articles
-
Screening TCGA database for prognostic genes in lower grade glioma microenvironment.Ann Transl Med. 2020 Mar;8(5):209. doi: 10.21037/atm.2020.01.73. Ann Transl Med. 2020. PMID: 32309356 Free PMC article.
-
Identification of Immune Cell Infiltration and Immune-Related Genes in the Tumor Microenvironment of Glioblastomas.Front Immunol. 2020 Oct 20;11:585034. doi: 10.3389/fimmu.2020.585034. eCollection 2020. Front Immunol. 2020. PMID: 33193404 Free PMC article.
-
Mining TCGA database for genes of prognostic value in glioblastoma microenvironment.Aging (Albany NY). 2018 Apr 16;10(4):592-605. doi: 10.18632/aging.101415. Aging (Albany NY). 2018. PMID: 29676997 Free PMC article.
-
A new prognostic model for glioblastoma multiforme based on coagulation-related genes.Transl Cancer Res. 2023 Oct 31;12(10):2898-2910. doi: 10.21037/tcr-23-322. Epub 2023 Oct 10. Transl Cancer Res. 2023. PMID: 37969372 Free PMC article.
-
Bioinformatics analysis of microenvironment-related genes associated with radioresistance in glioblastoma.Transl Cancer Res. 2020 Dec;9(12):7495-7504. doi: 10.21037/tcr-20-2476. Transl Cancer Res. 2020. PMID: 35117350 Free PMC article.
Cited by
-
mRNA markers for survival prediction in glioblastoma multiforme patients: a systematic review with bioinformatic analyses.BMC Cancer. 2024 May 21;24(1):612. doi: 10.1186/s12885-024-12345-z. BMC Cancer. 2024. PMID: 38773447 Free PMC article.
-
Glioblastoma gene network reconstruction and ontology analysis by online bioinformatics tools.J Integr Bioinform. 2021 Nov 16;18(4):20210031. doi: 10.1515/jib-2021-0031. J Integr Bioinform. 2021. PMID: 34783229 Free PMC article.
-
Recognition of a Novel Gene Signature for Human Glioblastoma.Int J Mol Sci. 2022 Apr 9;23(8):4157. doi: 10.3390/ijms23084157. Int J Mol Sci. 2022. PMID: 35456975 Free PMC article.
-
Integrated analysis of inflammatory response subtype-related signature to predict clinical outcomes, immune status and drug targets in lower-grade glioma.Front Pharmacol. 2022 Aug 26;13:914667. doi: 10.3389/fphar.2022.914667. eCollection 2022. Front Pharmacol. 2022. PMID: 36091778 Free PMC article.
-
Exploring glioblastoma stem cell heterogeneity: Immune microenvironment modulation and therapeutic opportunities.Front Oncol. 2022 Sep 21;12:995498. doi: 10.3389/fonc.2022.995498. eCollection 2022. Front Oncol. 2022. PMID: 36212415 Free PMC article. Review.
References
-
- Rock K, McArdle O, Forde P, Dunne M, Fitzpatrick D, O'Neill B, et al. . A clinical review of treatment outcomes in glioblastoma multiforme-the validation in a non-trial population of the results of a randomised Phase III clinical trial: has a more radical approach improved survival? Br J Radiol. (2012) 85:E729–33. 10.1259/bjr/83796755 - DOI - PMC - PubMed
LinkOut - more resources
Full Text Sources

