. 2021 May 21:12:639260.
doi: 10.3389/fimmu.2021.639260. eCollection 2021.

Galectin-Receptor Interactions Regulates Cardiac Pathology Caused by Trichinella spiralis Infection

Affiliations

Galectin-Receptor Interactions Regulates Cardiac Pathology Caused by Trichinella spiralis Infection

Jinghai Yan et al. Front Immunol. .

Abstract

The parasitic nematode Trichinella spiralis causes trichinellosis, a serious food-borne parasitic zoonosis worldwide. Infection with T. spiralis may also cause myocarditis. In the present study, we used mouse models to assess the impact of blockage of galectin-receptor interactions by α-lactose on cardiac immunopathology during acute T. spiralis experimental infection. Our data demonstrated that, after T. spiralis infection, blockage of galectin-receptor interactions resulted in cardiac dysfunction detected by transthoracic conventional echocardiography, and increased serum Gal-3 level, a biomarker of myocardial damage. In addition, there were increased eosinophil number in peripheral blood, and increased eosinophil infiltration in the heart and spleen tissues accompanied with increased mRNA levels of eosinophil granule proteins (including eosinophil cationic protein (ECP) and eosinophil peroxidase (EPO)) and IL-5 in these organs; increased cardiac fibrosis accompanied with increased Gal-3 and collagen 1 expressions in the hearts of mice with blockage of galectin-receptor interactions after T. spiralis infection. Correlation analysis showed that significant positive correlations existed between the mRNA levels of Gal-3 and ECP/EPO/eosinophil major basic protein/IL-5/CCL11/CCR3/α-SMA/collagen 1 in the hearts of both T. spiralis-infected mice and T. spiralis-infected mice with blockage of galectin-receptor interactions. Our data suggest that galectin-receptor interactions play a pivotal role during acute T. spiralis infection, and lack of galectin-receptor interactions upregulates Gal-3 which, in turn, leads to elevated heart eosinophil recruitment, exacerbated heart pathology and fibrosis, and heart functional damage.

Keywords: Gal-3; T. spiralis; eosinophils; galectin-receptor interaction; mice; myocarditis.


Conflict of interest statement

The authors declare that the research was conducted in the absence of any commercial or financial relationships that could be construed as a potential conflict of interest.

Figures

Figure 1
Figure 1
Histopathology and eosinophil counts in different groups of mice. Histopathology of heart (A) and spleen (C). No histopathological changes and eosinophils were observed in the heart (a, b) and spleen (i, j) tissues of uninfected mice and in the heart (c, d) and spleen (k, l) tissues of uninfected mice with α-lactose treatment. Histopathological changes and obvious inflammation were observed in the heart (e, f) and spleen (m, n) tissues of T. spiralis-infected mice and in the heart (g, h) and spleen (o, p) tissues of T. spiralis-infected mice plus α-lactose treatment. Eosinophils indicated by red arrows were observed in the heart and spleen tissues of T. spiralis-infected mice and T. spiralis-infected mice plus α-lactose treatment. Original magnification 400× (scale bar = 50 µm) for a, c, e, g, i, k, m, and o; 1000× (scale bar = 20 µm) for b, d, f, h, j, l, n, and p; H&E stain. (B) Histopathological score analysis of the heart. (D) The eosinophil (EOS) count in the peripheral blood. Quantitative analysis of eosinophils in the heart (E) and spleen (F). The density of eosinophils was expressed as the number of eosinophils per square millimeter. Data are presented as means ± SD; there were eight mice in each group and the data shown are representative of those from two different experiments. ****P < 0.0001 vs. uninfected control mice. #### P < 0.0001 vs. uninfected mice or uninfected mice with α-lactose treatment. & P < 0.05, && P < 0.01, and &&&& P < 0.0001 vs. T. spiralis-infected mice.
Figure 2
Figure 2
Cardiac fibrosis and mRNA levels of TGFβ-1, α-SMA, and collagen 1 in the hearts of different groups of mice. (A) Cardiac fibrosis. No obvious fibrosis was observed in the heart tissues of uninfected mice (a) and uninfected mice with α-lactose treatment (b); severe fibrosis was observed in the heart tissues of T. spiralis-infected mice (c) and T. spiralis-infected mice with α-lactose treatment (d). Original magnification 400× (scale bar = 50 µm); sirius red stain. (B) Quantitative analysis of fibrosis areas in the heart. The positive area of fibrosis was expressed as percentage. (C) The mRNA expression levels of TGFβ-1, α-SMA, and collagen 1 in the heart. Data are presented as means ± SD; there were eight mice in each group and the data shown are representative of those from two different experiments. ** P < 0.01, *** P < 0.001, and **** P < 0.0001 vs. uninfected mice. ### P < 0.001 and #### P < 0.0001 vs. uninfected mice or uninfected mice with α-lactose treatment. && P < 0.01 and &&& P < 0.001 vs. T. spiralis-infected mice.
Figure 3
Figure 3
The serum levels of Gal-3 (A) and cTnT (B), and the M-mode echocardiography (C) of different groups of mice. Uninfected mice (a), uninfected mice with α-lactose treatment (b), T. spiralis-infected mice (c), and T. spiralis-infected mice with α-lactose treatment (d). ** P < 0.01 vs. uninfected mice. #### P < 0.0001 vs. uninfected mice or uninfected mice with α-lactose treatment. && P < 0.01 vs. T. spiralis-infected mice.
Figure 4
Figure 4
The mRNA levels of Gal-1, Gal-3, and Gal-9 in the hearts (A) and spleens (B), and immunohistochemical detection of Gai-3 (C) and quantitative analysis of Gal-3 positive areas in the hearts (D) of different groups of mice. The mRNA expression values are means from triplicate measurements and data are presented as means ± SD. Immunohistochemistry for Gal-3 (brown color) in the heart tissues of uninfected mice (a), uninfected mice with α-lactose treatment (b), T. spiralis-infected mice (c), and T. spiralis-infected mice with α-lactose treatment (d). Original magnification 400× (scale bar = 50 µm). The positive area of Gal-3 was expressed as percentage. Data are presented as means ± SD; there were eight mice in each group and the data shown are representative of those from two different experiments. ** P < 0.01 and **** P < 0.0001 vs. uninfected control mice. #### P < 0.0001 vs. uninfected mice or uninfected mice with α-lactose treatment. &&& P < 0.001 vs. T. spiralis-infected mice.
Figure 5
Figure 5
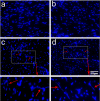
Expression of extracellular traps in the heart tissues of different groups of mice. Fluorescence staining showed no extracellular trap in uninfected mice (a) and uninfected mice with α-lactose treatment (b). Inflammatory cells released DNA extracellular traps (red arrows) were observed in the heart tissues of T. spiralis-infected mice (c) and T. spiralis-infected mice with α-lactose treatment (d). Original magnification 400× (scale bar = 50 µm).
Figure 6
Figure 6
The mRNA levels of ECP, EPO, MBP, IL-5, CCL11, CCR3, and CCL24 in the hearts (A) and spleens (B) of different groups of mice. Values are means from triplicate measurements and data are presented as means ± SD; there were eight mice in each group and the data shown are representative of those from two different experiments. * P < 0.05, ** P < 0.01, *** P < 0.001, and **** P < 0.0001 vs. uninfected mice. ## P < 0.01, ### P < 0.001, and #### P < 0.0001 vs. uninfected mice or uninfected mice with α-lactose treatment. & P < 0.05 and && P < 0.01 vs. T. spiralis-infected mice.
Figure 7
Figure 7
Correlation analysis between the mRNA expression levels of Gal-3 and ECP, EPO, MBP, IL-5, CCL11, CCR3, α-SMA, or collagen 1 in the heart of T. spiralis-infected mice (A) and T. spiralis-infected mice with α-lactose treatment (B). The r value generates the theoretical line of best fit, and the P value indicates the significance of the correlation. There were eight mice in each group and the data shown are representative of those from two different experiments.

Similar articles

Cited by

References

    1. Rostami A, Gamble HR, Dupouy-Camet J, Khazan H, Bruschi F. Meat Sources of Infection for Outbreaks of Human Trichinellosis. Food Microbiol (2017) 64:65–71. 10.1016/j.fm.2016.12.012 - DOI - PubMed
    1. Pozio E, Hoberg E, La Rosa G, Zarlenga DS. Molecular Taxonomy, Phylogeny and Biogeography of Nematodes Belonging to the Trichinella Genus. Infect Genet Evol (2009) 9:606–16. 10.1016/j.meegid.2009.03.003 - DOI - PubMed
    1. Mukaratirwa S, La Grange L, Pfukenyi DM. Trichinella Infections in Animals and Humans in Sub-Saharan Africa: A Review. Acta Trop (2013) 125:82–9. 10.1016/j.actatropica.2012.09.005 - DOI - PubMed
    1. Cui J, Wang ZQ, Xu BL. The Epidemiology of Human Trichinellosis in China During 2004-2009. Acta Trop (2011) 118(1):1–5. 10.1016/j.actatropica.2011.02.005 - DOI - PubMed
    1. Rawla P, Sharma S. “Trichinella Spiralis”. In: Statpearls. Treasure Island (FL): StatPearls Publishing; (2020).

MeSH terms