. 2021 May 20:12:653030.
doi: 10.3389/fimmu.2021.653030. eCollection 2021.

Study on the Immune Escape Mechanism of Acute Myeloid Leukemia With DNMT3A Mutation

Affiliations

Study on the Immune Escape Mechanism of Acute Myeloid Leukemia With DNMT3A Mutation

Yimei Que et al. Front Immunol. .

Abstract

DNA (cytosine-5)-methyltransferase 3A (DNMT3A)-mutated acute myeloid leukemia (AML) has a poor prognosis, but the exact mechanism is still unclear. Here, we aimed to explore the mechanism of immune escape in AML with DNMT3A mutation. We constructed a DNMT3A knockout clone and DNMT3A-R882H-mutated clones. RNA-seq results showed that transcription factors and macrophage inflammatory proteins were significantly downregulated in the DNMT3A mutant clones. KEGG enrichment and gene set enrichment analysis (GSEA) showed that a large number of genes were enriched in inflammatory immune-related pathways, such as the toll-like receptor signaling pathway. Therefore, we co-cultured AML cells with macrophages. The DNMT3A-mutated AML cells attenuated M1 macrophage polarization and resisted its killing effect in vitro and in vivo. In xenografts, the tumor volumes in the experimental group were significantly larger than those in the control group, and the proportion of M2 macrophages was significantly higher. After the co-culture, the increase in pro-inflammatory cytokine expression in the mutant cells was significantly lower than that in the control group, while that in immunosuppressive factors was not significantly different. In co-cultivated supernatants, the concentration of inflammatory factors in the experimental group was significantly lower than that in the control group, while that of immunosuppressive factors was significantly higher. Resistin significantly promoted the expression of inflammatory proteins in AML cells. It relieved the inhibitory effect of DNMT3A mutation, promoted the phenotypic recovery of the co-cultured macrophages, eliminated resistance, and regulated the immune microenvironment. Thus, resistin may serve as an ancillary drug for patients with DNMT3A-mutated AML.

Keywords: AML; DNMT3A; epigenetics; immune escape; immune microenvironment; macrophage polarization.


Conflict of interest statement

The authors declare that the research was conducted in the absence of any commercial or financial relationships that could be construed as a potential conflict of interest.

Figures

Figure 1
Figure 1
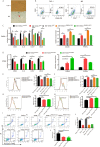
The construction of DNMT3A knockout (KO) cells and DNMT3A-R882H mutant cells. (A) -1 and -14 frameshift mutations in the DNMT3A allele sequence of SKM-1KO monoclonal cells. (B) SKM-1KO cells did not express DNMT3A. (C, D) DNMT3A-R882H mRNA and protein expression levels in the constructed SKM-1R882H SC1 and SKM-1R882H SC2 clones. (E) SKM-1KO and SKM-1R882H cells were more resistant to cytarabine than the control group (SKM-1NC). (F) CCK8 assay showed no significant difference in proliferation of SKM-1R882H, SKM-1KO, SKM-1control, and SKM-1NC cells before and after 1 µM cytarabine treatment. All the results are presented as mean ± standard deviation of three independent experiments (n = 3). ***p < 0.0001 represent significant differences compared with the control. ns, no significance.
Figure 2
Figure 2
The difference in gene expression between SKM-1R882H, SKM-1KO and SKM-1WT cells. (A) Cluster analysis of differential genes, red means upregulated expression, green means downregulated expression. (B) The volcanic map analysis of differentially expressed genes (fold change ≥ 2 and p-Value ≤ 0.05), the red indicates the significantly upregulated gene, the green indicates the significant downregulated. (C) KEGG pathway enrichment analysis. The size of the circle indicates the number of differential genes, and the warm and cold color indicates the size of the P-value. The ordinate indicates the enrichment pathway, and the abscissa indicates the enrichment score. Inflammation- and immune-related pathways was marked in red. (D) GSEA indicates that the TLR pathway was downregulated in knockout (KO) and R882H cells. (E) Cluster analysis of the differential genes. (F) Interaction networks functional enrichment analysis of differential proteins. Red circles indicate key regulatory factors.
Figure 3
Figure 3
DNMT3A-mutated AML cells attenuated M1 macrophage polarization and resist its killing effect in vitro. (A) The morphological changes of THP-1 differentiation into M0 macrophages, the red arrow points to M0 macrophages. (B) The expression of CD68 in THP-1 after stimulation with PMA. (C, D) The mRNA expression of CD86, IL-6, iNOS, CCR7 (M1 marker) and CD206, PPAR-γ (M2 marker) was measured by qRT-PCR in macrophages after co-cultured with SKM-1 cells and K562 cells respectively. (E–H) The expression of CD86 and CD206 in macrophages after co-cultured with AML cells was analyzed using flow cytometry. The histogram is a statistical graph of the flow chart. (I–L) Representative dot plots and column diagram showing the apoptosis rate of AML cells after co-cultured with M1 macrophages. All the results are presented as mean ± standard deviation of three independent experiments (n = 3). *p < 0.05, **p < 0.01, and ***p < 0.0001 represent significant differences compared with the control.
Figure 4
Figure 4
DNMT3A-mutated AML cells attenuated M1 macrophage polarization and resist its killing effect in vivo. (A) The expression of CD86 in M0 macrophages after stimulation with Lipopolysaccharide (LPS). (B, C) The tumor volume of the experimental and the control group after the co-culture with M1 macrophages in vivo, n = 3. (D) Immunofluorescence showed the number of CD68+CD163+ double-positive cells (M2 macrophages) infiltrating the tumor tissue. CD68 (macrophage marker) in green, CD163 (M2 marker) in red, nuclei in blue, and the purple arrow points to M2 macrophages. (E) Statistical graph of CD163-red fluorescence intensity. All the results are presented as mean ± standard deviation of three independent experiments (n = 3). ***p < 0.0001 represent significant differences compared with the control.
Figure 5
Figure 5
DNMT3A mutation inhibits the expression of pro-inflammatory factors in AML cells and inhibits anti-tumor immunity. (A, B) The mRNA expression of MIP-1α, MIP-1β, IL-1β (pro-inflammatory factors) and TGF-β, IL-10 (immunosuppressive factors) was measured by qRT-PCR in SKM-1 cells and K562 cells respectively after co-cultured with macrophages. (C, D) The secretion of inflammatory factors in the co-cultured supernatant was measured by ELISA. All the results are presented as mean ± standard deviation of three independent experiments (n = 3). *p < 0.05, **p < 0.01, and ***p < 0.0001 represent significant differences compared with the control. ns, no significance.
Figure 6
Figure 6
DNMT3A mutated AML cells regulate the macrophage phenotype by suppressing transcription factors AP-1. (A, B) The mRNA expression of MIP-1α, MIP-1β, IL-1β was measured by qRT-PCR in SKM-1 cells and K562 cells after stimulation with resistin. (C, D) The mRNA expression of MIP-1α, MIP-1β, IL-1β (pro-inflammatory factors) and TGF-β, IL-10 (immunosuppressive factors) was measured using qRT-PCR in SKM-1 cells and K562 cells treated with resistin after co-cultured with macrophages. (E, F) The mRNA expression of CD86, IL-6, iNOS, CCR7 (M1 marker) and CD206, PPAR-γ (M2 marker) was measured using qRT-PCR in macrophages after the co-culture with AML cells treated with resistin. (G–J) The expression of CD86 and CD206 in macrophages after the co-culture with AML cells treated with resistin was analyzed using flow cytometry. The histogram is a statistical graph of the flow chart. *p < 0.05, **p < 0.01, and ***p < 0.0001. ns, no significance.
Figure 7
Figure 7
DNMT3A mutated AML cells regulate the macrophage phenotype by suppressing transcription factors AP-1. (A–D) Representative dot plots and column diagram showing the apoptosis rate of AML cells treated with resistin after the co-culture with M1 macrophages. (E, F) The secretion of inflammatory factors in the supernatant of macrophages and resistin-treated AML cells was measured by ELISA. All the results are presented as mean ± standard deviation of three independent experiments (n = 3). *p < 0.05, **p < 0.01, and ***p < 0.0001 represent significant differences compared with the control. ns, no significance.

Similar articles

Cited by

References

    1. Wouters BJ, Delwel R. Epigenetics and Approaches to Targeted Epigenetic Therapy in Acute Myeloid Leukemia. Blood (2016) 127(1):42–52. 10.1182/blood-2015-07-604512 - DOI - PubMed
    1. Chaudry SF, Chevassut TJ. Epigenetic Guardian: A Review of the DNA Methyltransferase DNMT3A in Acute Myeloid Leukaemia and Clonal Haematopoiesis. BioMed Res Int (2017) 2017:5473197. 10.1155/2017/5473197 - DOI - PMC - PubMed
    1. Spencer DH, Russler-Germain DA, Ketkar S, Helton NM, Lamprecht TL, Fulton RS, et al. . Cpg Island Hypermethylation Mediated by DNMT3A is a Consequence of AML Progression. Cell (2017) 168(5):801–16:e13. 10.1016/j.cell.2017.01.021 - DOI - PMC - PubMed
    1. Yang L, Rau R, Goodell MA. DNMT3A in Haematological Malignancies. Nat Rev Cancer (2015) 15(3):152–65. 10.1038/nrc3895 - DOI - PMC - PubMed
    1. Russler-Germain DA, Spencer DH, Young MA, Lamprecht TL, Miller CA, Fulton R, et al. . The R882H DNMT3A Mutation Associated With AML Dominantly Inhibits Wild-Type DNMT3A by Blocking its Ability to Form Active Tetramers. Cancer Cell (2014) 25(4):442–54. 10.1016/j.ccr.2014.02.010 - DOI - PMC - PubMed

Publication types

MeSH terms