. 2021 May 21:12:658681.
doi: 10.3389/fimmu.2021.658681. eCollection 2021.

Fusobacterium nucleatum Facilitates M2 Macrophage Polarization and Colorectal Carcinoma Progression by Activating TLR4/NF- κ B/S100A9 Cascade

Affiliations

Fusobacterium nucleatum Facilitates M2 Macrophage Polarization and Colorectal Carcinoma Progression by Activating TLR4/NF- κ B/S100A9 Cascade

Lijun Hu et al. Front Immunol. .

Abstract

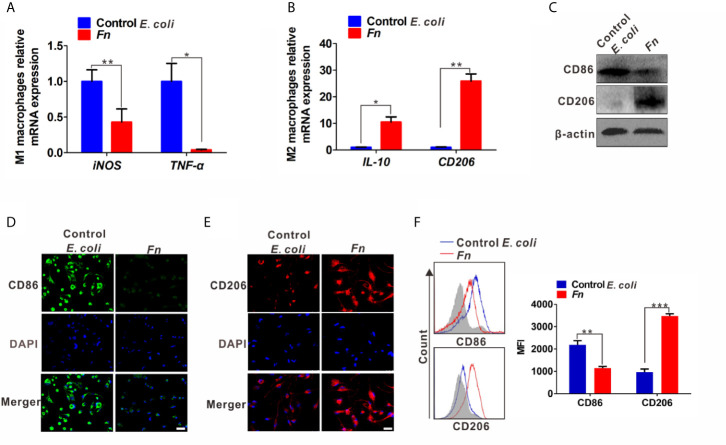
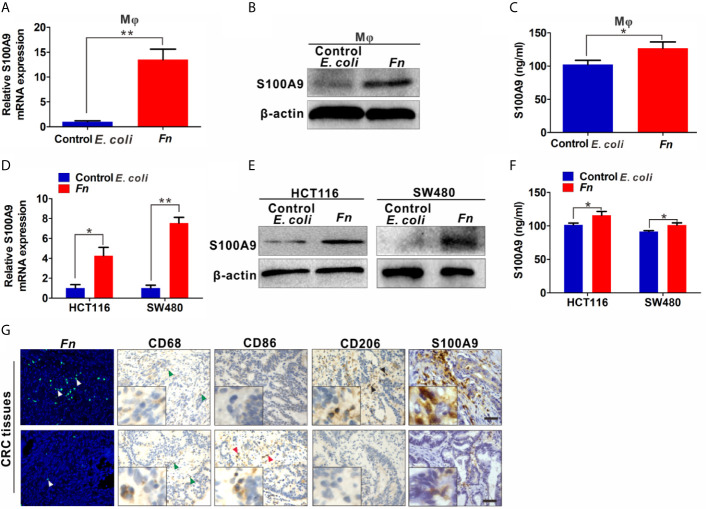
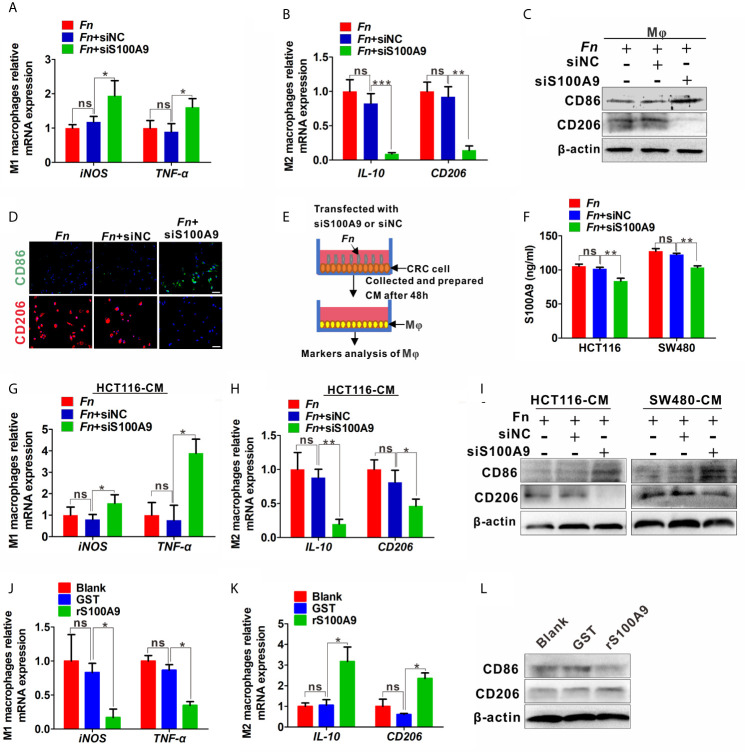
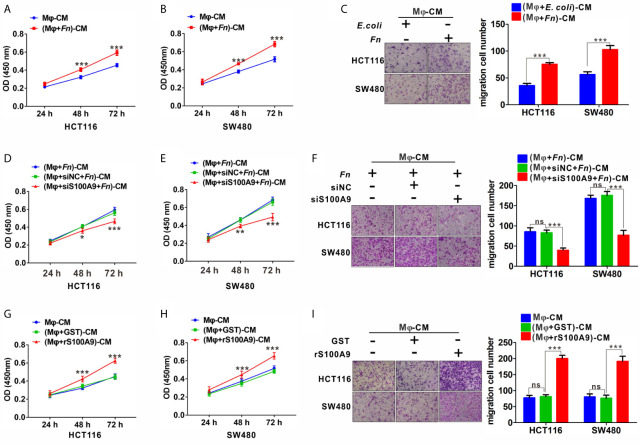
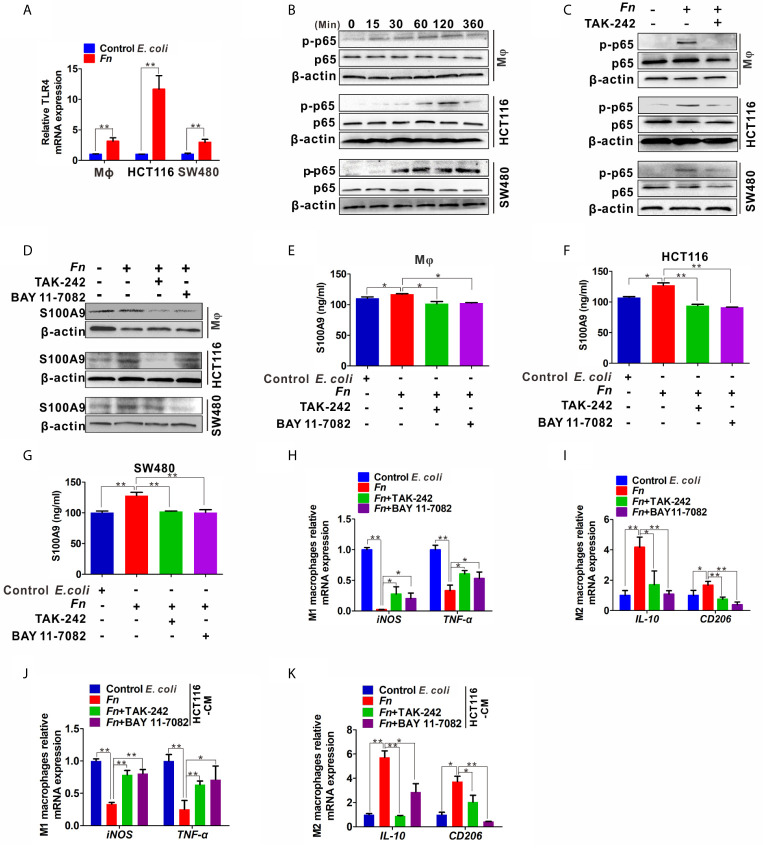
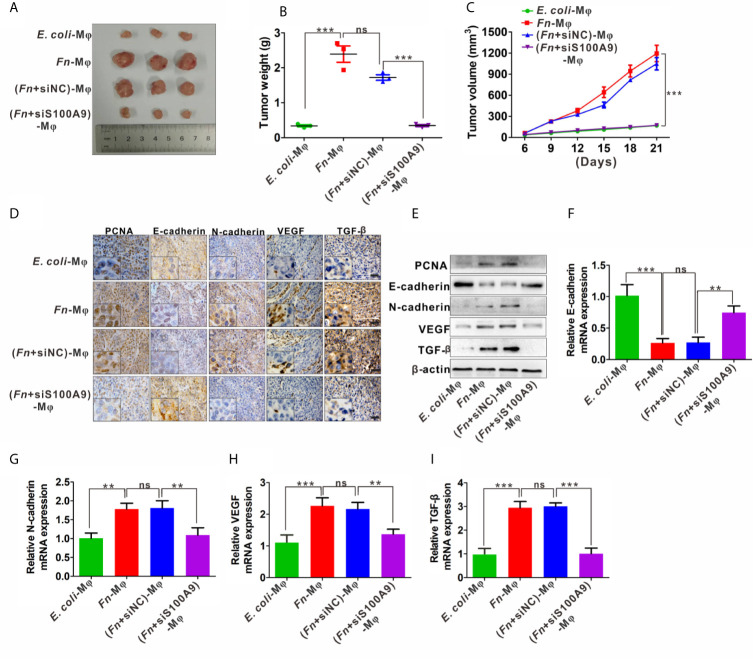
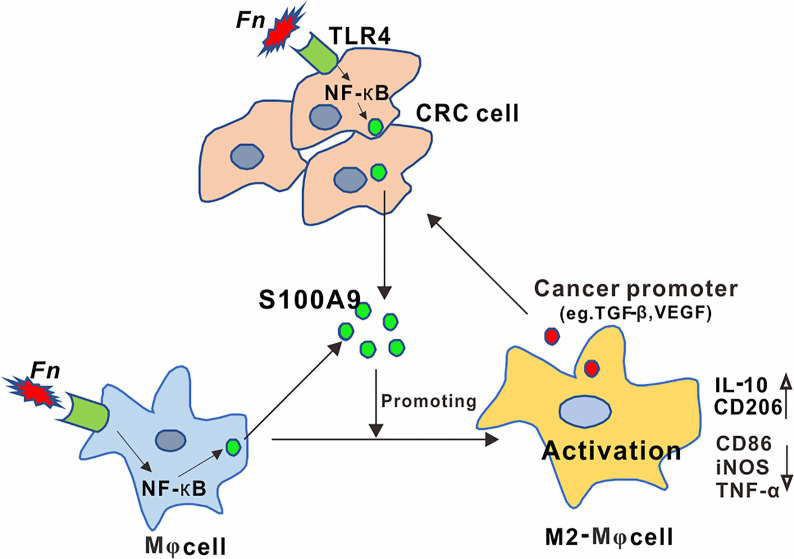
Fusobacterium nucleatum (Fn) has been considered as a significant contributor in promoting colorectal carcinoma (CRC) development by suppressing host anti-tumor immunity. Recent studies demonstrated that the aggregation of M2 macrophage (Mφ) was involved in CRC progress driven by Fn infection. However, the underlying molecular mechanisms are poorly characterized. Here, we investigated the role of Fn in Mφ polarization as well as its effect on CRC malignancy. Fn infection facilitated differentiation of Mφ into the M2-like Mφ phenotype by in vitro study. Histological observation from Fn-positive CRC tissues confirmed the abundance of tumor-infiltrating M2-like Mφ. Fn-induced M2-like Mφ polarization was weakened once inhibiting a highly expressed damage-associated molecular pattern (DAMP) molecule S100A9 mainly derived from Fn-challenged Mφ and CRC cells. In addition, Fn-challenged M2-like Mφ conferred CRC cells a more malignant phenotype, showing stronger proliferation and migration characteristics in vitro and significantly enhanced tumor growth in vivo, all of which were partially inhibited when S100A9 was lost. Mechanistic studies further demonstrated that activation of TLR4/NF-κB signaling pathway mediated Fn-induced S100A9 expression and subsequent M2-like Mφ activation. Collectively, these findings indicate that elevated S100A9 in Fn-infected CRC microenvironment participates in M2-like Mφ polarization, thereby facilitating CRC malignancy. Furthermore, targeting TLR4/NF-κB/S100A9 cascade may serve as promising immunotherapeutic strategy for Fn-associated CRC.

Keywords: Fusobacterium nucleatum; S100A9; TLR4; colorectal carcinoma; macrophage.


Conflict of interest statement

The authors declare that the research was conducted in the absence of any commercial or financial relationships that could be construed as a potential conflict of interest.

Figures

Figure 1
Figure 1
Fn promotes M2-like polarization of Mφ in vitro. (A, B) qPCR analysis for mRNA levels of M1 markers (iNOS and TNF-α) and M2 markers (IL-10 and CD206) in Mφ co-cultured with control E. coli i or Fn for 24 h. (C) Western blot analysis of M1 marker (CD86) and M2 marker (CD206) expression in Mφ co-cultured with control E. coli or Fn for 48 h. (D, E) Representative immunofluorescence images of CD86+ and CD206+ Mφ after treatment with control E. coli or Fn for 48 h. CD86 was stained with Alexa Fluor 488 (green), CD206 was stained with Cy3 (red). Scale bars: 50 µm. (F) Flow cytometry analysis was performed to detect CD86+ and CD206+ Mφ after treatment with control E. coli or Fn for 48 h. A statistical mean fluorescence intensity (MFI) for CD86+ and CD206+ Mφ is shown in the right panel. Data were expressed as means ± SD in three independent experiments. *p < 0.05, **p < 0.01, ***p < 0.001.
Figure 2
Figure 2
S100A9 expression is up-regulated in Fn-challenged Mφ and CRC cells. (A–F) Mφ and CRC cells were co-cultured with control E. coli or Fn. S100A9 levels were detected by qPCR (A, D), Western blot (B, E) and ELISA (C, F). (G) Representative images of CD68+ Mφ, CD86+ Mφ, CD206+ Mφ, and S100A9 expression in the TME of Fn-positive CRC tissues. White arrow: Fn; blue arrow: CD68+ Mφ; red arrow: CD86+ Mφ; black arrow: CD206+ Mφ. Scale bars: 50 µm. Data were expressed as means ± SD in three independent experiments. *p < 0.05, **p < 0.01.
Figure 3
Figure 3
S100A9 is involved in M2-like Mφ polarization in the presence of Fn in CRC. (A–C) Mφs were transfected with siNC or siS100A9 and subsequently co-cultured with Fn. The levels of M1 markers and M2 markers in Mφ were detected by qPCR (A, B) and Western blot (C). (D) Representative immunofluorescence images of CD86+ and CD206+ in Mφ infected with Fn and then transfected with siNC or siS100A9. CD86 was stained with Alexa Fluor 488 (green); CD206 was stained with Cy3 (red). Scale bars: 50 µm. (E, F) HCT116 and SW480 cells were transfected with siNC or siS100A9 and then infected with Fn. After 48 h, the supernatant of each group was collected and used to culture Mφ in the next experiment (E). ELISA analysis for S100A9 expression in the supernatant of HCT116 and SW480 cells (F). (G–I) Mφs were co-cultured with the CM from CRC cells. The levels of M1 markers and M2 markers in Mφ were detected by qPCR (G, H) and Western blot (I). (J–L) Mφs were treated with GST or rS100A9. The levels of M1 markers and M2 markers in Mφ were detected by qPCR (J, K) and Western blot (L). Data were expressed as means ± SD in three independent experiments. ns, not significant. *p < 0.05; **p < 0.01; ***p < 0.001.
Figure 4
Figure 4
Fn-challenged M2-Mφ, which was mediated by S100A9, promotes the proliferation and migration of CRC cells. (A, B) CCK8 assay was used to determine the proliferation ability of CRC cells co-cultured with (Mφ + E. coli)-CM or (Mφ + Fn)-CM for 24, 48, and 72 h. (C) Transwell assay was used to determine the migration ability of CRC cells co-cultured with (Mφ + E. coli)-CM or (Mφ + Fn)-CM for 24 h. Magnification, 100×. (D, E) CCK8 assay was used to determine the proliferation ability of CRC cells co-cultured with (Mφ + Fn)-CM, (Mφ + siNC + Fn)-CM, (Mφ + siS100A9 + Fn)-CM for 24, 48, and 72 h. (F) Transwell assay was used to determine the migration ability of CRC cells co-cultured with (Mφ + Fn)-CM, (Mφ + siNC + Fn)-CM, (Mφ + siS100A9 + Fn)-CM for 24 h. Magnification, 100×. (G, H) CCK8 assay was used to determine the proliferation ability of CRC cells co-cultured with untreated Mφ-CM, (Mφ + GST)-CM and (Mφ + rS100A9)-CM for 24, 48, and 72 h. (I) Transwell assay was used to determine the migration ability of CRC cells co-cultured with untreated Mφ-CM, (Mφ + GST)-CM and (Mφ + rS100A9)-CM for 24 h. Magnification, 100×. In (A, B, D, E, G, H), data shown are mean absorbances ± SD. In (C, F, I), data shown are mean migrating cells ± SD. ns, not significant. *p < 0.05, **p < 0.01, ***p < 0.001.
Figure 5
Figure 5
Expression of S100A9 and M2-like Mφ polarization is regulated by TLR4/NF-κB activation caused by Fn. (A) qPCR analysis of TLR4 expression in Mφ and CRC cells co-cultured with control E. coli or Fn for 48 h. (B) Western blot analysis of p65 and p-p65 expression in Mφ and CRC cells co-cultured with Fn for 0,15, 30, 60, 120 and 360 min. (C) Western blot analysis of p-p65 level in Mφ and CRC cells pretreated with or without inhibitor TAK-242 for 60 min and then co-cultured with control E. coli or Fn for 120 min. (D) Western blot analysis of S100A9 level in Mφ and CRC cells pretreated with or without inhibitors TAK-242 and NF-κB for 60 min and then co-cultured with control E. coli or Fn for 48 h. (E–G) ELISA analysis of S100A9 level in the CM of Mφ and CRC cells pretreated with or without inhibitors TAK-242 and Bay 11-7082 for 60 min and then co-cultured with control E. coli or Fn for 48 h. (H–K) qPCR analysis for mRNA levels of M1 markers (iNOS and TNF-α) and M2 markers (IL-10 and CD206) in Mφ. The cells were pretreated with or without inhibitors TAK-242 and Bay 11-7082 for 60 min and then co-cultured with control E. coli or Fn for 24 h (H, I) or co-cultured with the CM of HCT116 cells for 24 h (J, K). The CM of HCT116 cells were pretreated with or without inhibitors TAK-242 and Bay 11-7082 for 60 min and then co-cultured with control E. coli or Fn for 48 h. Data were expressed as means ± SD in three independent experiments. *p < 0.05, **p < 0.01.
Figure 6
Figure 6
Fn-caused M2 polarization mediated by S100A9 promotes the growth of subcutaneous tumor. (A) Representative images of tumors in mice co-injected with equal amount of HCT116 cells and control E. coli -treated, Fn-treated, (Fn + siNC)-treated or (Fn + siS100A9)-treated Mφ. (B) Images of tumor weights in different groups, n = 3/group. (C) Statistical analysis of tumor volumes in different groups, n = 3/group. (D) Representative immunohistochemistry images of PCNA, E-cadherin, N-cadherin, VEGF, and TFG-β proteins in representative xenograft tumor sections. Scale bars: 50 µm. (E) Western blot analysis of PCNA, E-cadherin, N-cadherin, VEGF, and TFG-β protein levels in representative xenograft tumor. (F–I) qPCR analysis of E-cadherin, N-cadherin, VEGF, and TGF-β expression in each xenograft tumor, n = 3/group. Data were expressed as means ± SD in three independent experiments. ns, not significant. **p < 0.01, ***p < 0.001.
Figure 7
Figure 7
Schematic diagram of the relationship among Fn, M2 polarization, and CRC progression. Activation of the TLR4/NF-κB cascade in Mφ and CRC cells by Fusobacterium nucleatum infection mediated high levels of S100A9 in CRC microenvironment, which led to M2-like Mφ phenotype showing increased IL-10 and CD206 levels, contributing to CRC malignance.

Similar articles

Cited by

References

    1. Song M, Garrett WS, Chan AT. Nutrients, Foods, and Colorectal Cancer Prevention. Gastroenterology (2015) 148(6):1244–60.e1216. 10.1053/j.gastro.2014.12.035 - DOI - PMC - PubMed
    1. Eser S, Chang J, Charalambous H, Silverman B, Demetriou A, Yakut C, et al. . Incidence Patterns of Colorectal Cancers in Four Countries of the Middle East Cancer Consortium (Cyprus, Jordan, Israel, and Izmir, Turkey) Compared With Those in the United States Surveillance, Epidemiology, and End Results Program. Turk J Gastroenterol (2018) 29(1):36–44. 10.5152/tjg.2018.17263 - DOI - PMC - PubMed
    1. Siegel RL, Miller KD, Goding Sauer A, Fedewa SA, Butterly LF, Anderson JC, et al. . Colorectal Cancer Statistics, 2020. CA Cancer J Clin (2020) 70(3):145–64. 10.3322/caac.21601 - DOI - PubMed
    1. Sun J, Kato I. Gut Microbiota, Inflammation and Colorectal Cancer. Genes Dis (2016) 3(2):130–43. 10.1016/j.gendis.2016.03.004 - DOI - PMC - PubMed
    1. Garcia-Castillo V, Sanhueza E, McNerney E, Onate SA, Garcia A. Microbiota Dysbiosis: A New Piece in the Understanding of the Carcinogenesis Puzzle. J Med Microbiol (2016) 65(12):1347–62. 10.1099/jmm.0.000371 - DOI - PubMed

Publication types

MeSH terms