

In Patients With Obesity, the Number of Adipose Tissue Mast Cells Is Significantly Lower in Subjects With Type 2 Diabetes
- PMID: 34093556
- PMCID: PMC8177010
- DOI: 10.3389/fimmu.2021.664576
In Patients With Obesity, the Number of Adipose Tissue Mast Cells Is Significantly Lower in Subjects With Type 2 Diabetes
Abstract
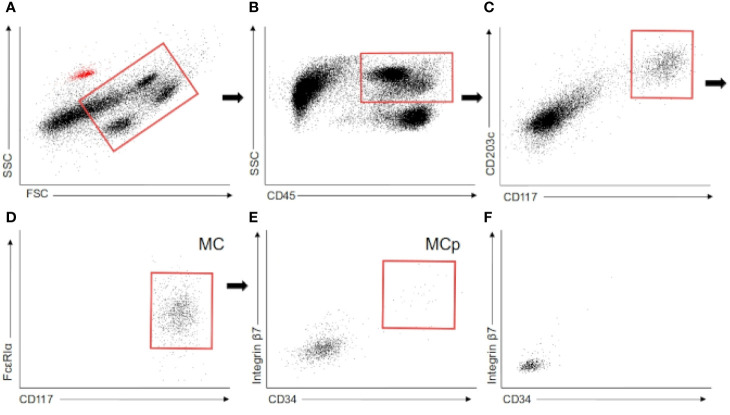
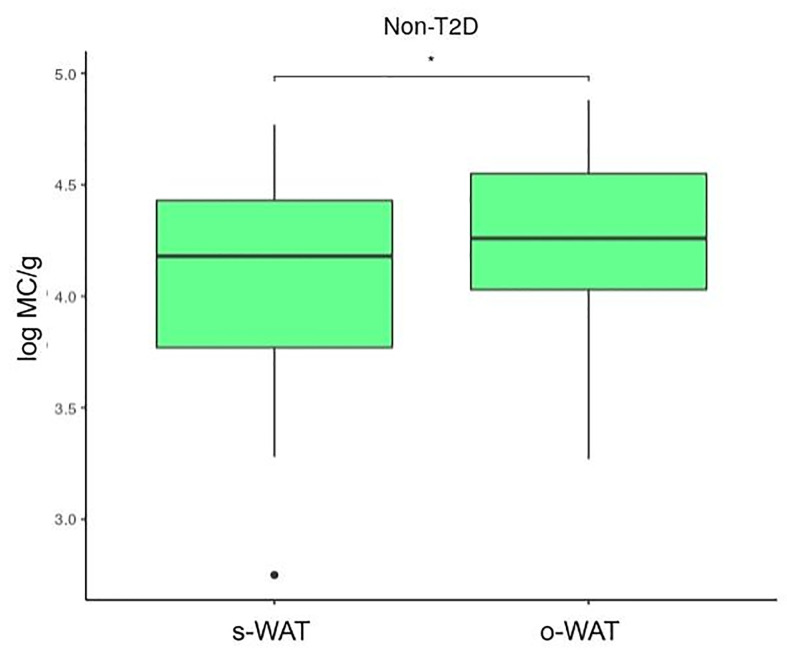
Type 2 diabetes (T2D) is a rising global health problem mainly caused by obesity and a sedentary lifestyle. In healthy individuals, white adipose tissue (WAT) has a relevant homeostatic role in glucose metabolism, energy storage, and endocrine signaling. Mast cells contribute to these functions promoting WAT angiogenesis and adipogenesis. In patients with T2D, inflammation dramatically impacts WAT functioning, which results in the recruitment of several leukocytes, including monocytes, that enhance this inflammation. Accordingly, the macrophages population rises as the WAT inflammation increases during the T2D status worsening. Since mast cell progenitors cannot arrive at WAT, the amount of WAT mast cells depends on how the new microenvironment affects progenitor and differentiated mast cells. Here, we employed a flow cytometry-based approach to analyze the number of mast cells from omental white adipose tissue (o-WAT) and subcutaneous white adipose tissue (s-WAT) in a cohort of 100 patients with obesity. Additionally, we measured the number of mast cell progenitors in a subcohort of 15 patients. The cohort was divided in three groups: non-T2D, pre-T2D, and T2D. Importantly, patients with T2D have a mild condition (HbA1c <7%). The number of mast cells and mast cell progenitors was lower in patients with T2D in both o-WAT and s-WAT in comparison to subjects from the pre-T2D and non-T2D groups. In the case of mast cells in o-WAT, there were statistically significant differences between non-T2D and T2D groups (p = 0.0031), together with pre-T2D and T2D groups (p=0.0097). However, in s-WAT, the differences are only between non-T2D and T2D groups (p=0.047). These differences have been obtained with patients with a mild T2D condition. Therefore, little changes in T2D status have a huge impact on the number of mast cells in WAT, especially in o-WAT. Due to the importance of mast cells in WAT physiology, their decrease can reduce the capacity of WAT, especially o-WAT, to store lipids and cause hypoxic cell deaths that will trigger inflammation.
Keywords: T2D; adipogenesis; adipose tissue; angiogenesis; flow cytometry; inflammation; mast cell; obesity.
Copyright © 2021 Lopez-Perez, Redruello-Romero, Garcia-Rubio, Arana, Garcia-Escudero, Tamayo, Puentes-Pardo, Moreno-SanJuan, Salmeron, Blanco, Galvez, Leon and Carazo.
Conflict of interest statement
The authors declare that the research was conducted in the absence of any commercial or financial relationships that could be construed as a potential conflict of interest.
Figures


Similar articles
-
In Obese Patients With Type 2 Diabetes, Mast Cells in Omental Adipose Tissue Decrease the Surface Expression of CD45, CD117, CD203c, and FcϵRI.Front Endocrinol (Lausanne). 2022 Mar 15;13:818388. doi: 10.3389/fendo.2022.818388. eCollection 2022. Front Endocrinol (Lausanne). 2022. PMID: 35370964 Free PMC article.
-
Mast cells in human adipose tissue: link with morbid obesity, inflammatory status, and diabetes.J Clin Endocrinol Metab. 2012 Sep;97(9):E1677-85. doi: 10.1210/jc.2012-1532. Epub 2012 Jun 28. J Clin Endocrinol Metab. 2012. PMID: 22745246
-
Adipose tissue specific CCL18 associates with cardiometabolic diseases in non-obese individuals implicating CD4+ T cells.Cardiovasc Diabetol. 2023 Apr 12;22(1):84. doi: 10.1186/s12933-023-01803-w. Cardiovasc Diabetol. 2023. PMID: 37046242 Free PMC article.
-
Adipose tissue plasticity: how fat depots respond differently to pathophysiological cues.Diabetologia. 2016 Jun;59(6):1075-88. doi: 10.1007/s00125-016-3933-4. Epub 2016 Apr 4. Diabetologia. 2016. PMID: 27039901 Free PMC article. Review.
-
Contribution of adipogenesis to healthy adipose tissue expansion in obesity.J Clin Invest. 2019 Oct 1;129(10):4022-4031. doi: 10.1172/JCI129191. J Clin Invest. 2019. PMID: 31573549 Free PMC article. Review.
Cited by
-
Obesogens: How They Are Identified and Molecular Mechanisms Underlying Their Action.Front Endocrinol (Lausanne). 2021 Nov 25;12:780888. doi: 10.3389/fendo.2021.780888. eCollection 2021. Front Endocrinol (Lausanne). 2021. PMID: 34899613 Free PMC article. Review.
-
Associations of levels of peripheral blood leukocyte and subtypes with type 2 diabetes: A longitudinal study of Chinese government employees.Front Endocrinol (Lausanne). 2023 Mar 24;14:1094022. doi: 10.3389/fendo.2023.1094022. eCollection 2023. Front Endocrinol (Lausanne). 2023. PMID: 37033252 Free PMC article.
-
What's gut got to do with it? The role of the microbiota and inflammation in the development of adiposity and obesity.Immunometabolism (Cobham). 2023 Jul 24;5(3):e00029. doi: 10.1097/IN9.0000000000000029. eCollection 2023 Jul. Immunometabolism (Cobham). 2023. PMID: 37492183 Free PMC article. Review.
-
Eosinophils in Colorectal Cancer: Emerging Insights into Anti-Tumoral Mechanisms and Clinical Implications.Int J Mol Sci. 2024 Jun 1;25(11):6098. doi: 10.3390/ijms25116098. Int J Mol Sci. 2024. PMID: 38892286 Free PMC article. Review.
-
Assessing Obesity-Related Adipose Tissue Disease (OrAD) to Improve Precision Medicine for Patients Living With Obesity.Front Endocrinol (Lausanne). 2022 Apr 29;13:860799. doi: 10.3389/fendo.2022.860799. eCollection 2022. Front Endocrinol (Lausanne). 2022. PMID: 35574032 Free PMC article. Review.