. 2021 May 21:12:690697.
doi: 10.3389/fimmu.2021.690697. eCollection 2021.

PARK7 Protects Against Chronic Kidney Injury and Renal Fibrosis by Inducing SOD2 to Reduce Oxidative Stress

Affiliations

PARK7 Protects Against Chronic Kidney Injury and Renal Fibrosis by Inducing SOD2 to Reduce Oxidative Stress

Lijun Yin et al. Front Immunol. .

Abstract

Renal fibrosis is the final common pathway to chronic kidney diseases regardless of etiology. Parkinson disease protein 7 (PARK7) is a multifunctional protein involved in various cellular processes, but its pathophysiological role in kidneys remain largely unknown. Here, we have determined the role of PARK7 in renal fibrosis and have further elucidated the underlying mechanisms by using the in vivo mouse model of unilateral ureteric obstruction (UUO) and the in vitro model of transforming growth factor-b (TGFB1) treatment of cultured kidney proximal tubular cells. PARK7 decreased markedly in atrophic kidney tubules in UUO mice, and Park7 deficiency aggravated UUO-induced renal fibrosis, tubular cell apoptosis, ROS production and inflammation. In vitro, TGFB1 treatment induced fibrotic changes in renal tubular cells, which was accompanied by alterations of PARK7. Park7 knockdown exacerbated TGFB1-induced fibrotic changes, cell apoptosis and ROS production, whereas Park7 overexpression or treatment with ND-13 (a PARK7-derived peptide) attenuated these TGFB1-induced changes. Mechanistically, PARK7 translocated into the nucleus of renal tubular cells following TGFB1 treatment or UUO, where it induced the expression of SOD2, an antioxidant enzyme. Taken together, these results indicate that PARK7 protects against chronic kidney injury and renal fibrosis by inducing SOD2 to reduce oxidative stress in tubular cells.

Keywords: PARK7; antioxidant; reactive oxygen species; renal fibrosis; tubular cells.


Conflict of interest statement

The authors declare that the research was conducted in the absence of any commercial or financial relationships that could be construed as a potential conflict of interest.

Figures
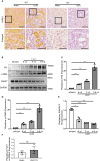
Figure 1
Figure 1
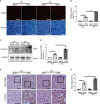
PARK7 is reduced in renal proximal tubules during UUO. C57BL/6 mice (female, 8weeks old) were subjected to sham operation or UUO surgery. The mice were euthanized at 4 days, 7 days or 14 days after surgery, and the UUO-obstructed kidneys were collected. (A) Representative images of histochemical staining of PARK7 in kidney tissues. Bar: 100μm in the top images and 50μm in the bottom enlarged images. (B) Representative blots of Fibronectin (FN), α-SMA, PARK7 and GAPDH(as protein loading control). (C–E) Densitometry of FN, α-SMA, and PARK7 signals(n=4). The signal of FN, α-SMA, or PARK7 was normalized to the GAPDH signal of the same samples to determine the ratios. The values are expressed as fold change over sham control. Each symbol (circle) represents an individual mouse. (F) Quantification of Park7 mRNA levels. Error bars: SEM. **p < 0.01, ***p < 0.001. ns, not significant.
Figure 2
Figure 2
PARK7 deficiency aggravates UUO-induced renal interstitial fibrosis. Park7 knockout (KO) and wildtype (WT) mice were subjected to either sham operation or UUO surgery. The mice were euthanized at 7 days and UUO-obstructed kidneys were collected. (A) Representative blots of PARK7, Fibronectin (FN), α-SMA and GAPDH(as a loading control). (B, C) Densitometry of FN and α-SMA signals(n=4). The signal of FN, α-SMA was normalized to the GAPDH signal of the same samples to determine the ratios. The values are expressed as fold change over sham control in WT mice. (D) Representative images of Masson’s trichrome staining and hematoxylin and eosin (H&E) staining. Bar: 100μm. (E) Quantitative analysis of Masson’s trichrome staining. (F) Tubular atrophy score(n=4). Tubular atrophy was graded by 0, 1 (1%‐25%), 2 (26%‐50%), 3 (51%‐75%), 4 (76%‐100% tubules showing atrophy. Each symbol (circle) represents an individual mouse. Error bars: SEM. *p < 0.05, **p < 0.01, ***p < 0.001.
Figure 3
Figure 3
Park7 deficiency increases tubular cell apoptosis and inflammation in UUO. Animals and their treatment were the same as described in Figure 2 . (A) Representative images of TUNEL analysis of kidney tissues. Bar:100μm. (B) Quantification of TUNEL-positive cells in kidney tissues(n=4). (C) Representative immunoblots of cleaved/activated caspase3 (C-CASP3) and GAPDH(as a loading control). (D) Densitometry of C-CASP3 signals(n=4). The signal of C-CASP3 was normalized to the GAPDH signal of the same samples to determine the ratios. The values are expressed as fold change over sham control in WT mice. (E) Representative images of macrophage staining. Bar: 100μm in the top images and 50μm in the bottom enlarged images. (F) Quantification of macrophage -positive cells(n=4). Each symbol (circle) represents an individual mouse. Error bars: SEM. *p < 0.05, **p < 0.01, ***p < 0.001.
Figure 4
Figure 4
Park7 deficiency accumulates ROS accumulation in renal tubular cells in UUO. Animals and their treatment were the same as described in Figure 2 . (A) Representative images of dihydroethidium (DHE) staining. DHE nuclear staining indicates the presence of reactive oxygen species(ROS). Bar:100μm. (B) Quantification of DHE fluorescence intensity (n=4). Each symbol (circle) represents an individual mouse. Error bars: SEM. ***p < 0.001.
Figure 5
Figure 5
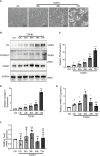
TGFB1 treatment altered PARK7 expression in BUMPT cells. BUMPT cells were incubated with 5 ng/ml TGFB1 for 12h to 72h, and the cells treated without TGFB1 were as control (Ctrl). (A) Representative images of contrast microscopy to show cellular morphologic changes. Bar:100μm. (B) Representative immunoblot of Fibronectin (FN), Collagen 1, PARK7 and GAPDH (protein loading control) in whole cell lysates. (C–E) Densitometry of FN, Collagen 1 and PARK7(n=3). The signal of FN, Collagen 1, or PARK7 was normalized to the GAPDH signal of the same samples to determine the ratios. The values are expressed as fold change over control cells. Each symbol (circle) represents an independent experiment. (F) Quantification of Park7 mRNA levels. Error bars: SEM. *p < 0.05, **p < 0.01, ***p < 0.001. ns, not significant.
Figure 6
Figure 6
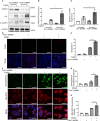
Park7 knockdown sensitizes BUMPT cells to TGFB1-induced fibrotic changes, apoptosis and ROS production. BUMPT cells were transfected with Park7- shRNA or scrambled-shRNA(Scr-shRNA), and at 24 hours after transfection, the cells were incubated with/without 5 ng/ml TGFB1 for another 24 hours. (A) Representative immunoblot of PARK7, Fibronectin (FN), cleaved/activated caspase 3(C-CASP3) and GAPDH (protein loading control). (B, C) Densitometry of FN and C-CASP3(n=3). The signal of FN, or C-CASP3 was normalized to the GAPDH signal of the same samples to determine the ratios. The values are expressed as fold change over control cells without Park7 shRNA transfection. (D) Representative images of TUNEL assay and DAPI staining (X200). Bar:100μm. (E) Apoptosis percentage(n=3). (F) Representative images of CM-H2DCFDA and Mito-SOX staining. Bar: 100μm in the CM-H2DCFDA image, 50μm in the Mito-SOX and Merge images. CM-H2DCFDA and Mito-SOX staining was performed to evaluate intracellular and mitochondrial ROS, respectively. (G, H) Quantification of CM-H2DCFDA and Mito-SOX fluorescence intensity(n=3). Each symbol (circle, diamond and trigon) represents an independent experiment. Error bars: SEM. *p < 0.05, **p < 0.01, ***p < 0.001.
Figure 7
Figure 7
PARK7 overexpression attenuates TGFB1-induced profibrotic changes, apoptosis and ROS production. BUMPT cells were transfected with PARK7 overexpression plasmid or empty vector, and 24 hours after transfection, the cells were cultured in medium with/without 5 ng/ml TGFB1 for another 24 hours. (A) Representative images of cell morphology. Bar: 100μm. (B) Representative immunoblot of Fibronectin (FN), cleaved/activated caspase 3(C-CASP3), MCY-Tag and GAPDH (protein loading control). (C, D) Densitometry of FN and C-CASP3 (n=3). The signal of FN, or C-CASP3 was normalized to the GAPDH signal of the same samples to determine the ratios. The values are expressed as fold change over control cells without Park7 overexpression. (E) Representative images of TUNEL assay and DAPI staining (X200). Bar: 100μm. (F) Apoptosis percentage (n=3). Greater than 200 cells in each group were evaluated to determine the percentage of TUNEL-positive cells. (G) Representative images of CM-H2DCFDA and Mito-SOX staining. Bar: 100μm in the CM-H2DCFDA image, 50μm in the Mito-SOX and Merge images. CM-H2DCFDA and Mito-SOX staining was performed to evaluate intracellular and mitochondrial ROS, respectively. (H, I) Quantification of CM-H2DCFDA and Mito-SOX fluorescence intensity (n=3). Each symbol (circle, diamond and trigon) represents an independent experiment. Error bars: SEM. *p < 0.05, **p < 0.01, ***p < 0.001.
Figure 8
Figure 8
ND-13 attenuates TGFB1-induced fibrosis changes in BUMPT cells. (A–F) BUMPT cells were cultured in medium with/without 5ng/ml TGFB1 in the presence/absence of ND13 for 24 hours. (A) Representative images of cell morphology. Bar: 100μm. (B) Representative immunoblot of Fibronectin (FN), GAPDH (protein loading control). (C) Densitometry of FN (n=3). The signal of FN was normalized to the GAPDH signal of the same samples to determine the ratios. The values are expressed as fold change over control cells. (D) Representative images of CM-H2DCFDA and Mito-SOX staining. Bar: 100μm in the CM-H2DCFDA image, 50μm in the Mito-SOX and Merge images. CM-H2DCFDA and Mito-SOX staining was performed to evaluate intracellular and mitochondrial ROS, respectively. (E, F) Quantification of CM-H2DCFDA and Mito-SOX fluorescence intensity (n=3). (G–J) C57BL/6 mice (female, 8weeks old) were subjected to sham operation or UUO surgery. Administration of ND-13 (2 mg/kg of body weight) via tail veil injection starting from the day of surgery and daily thereafter. The mice were euthanized at 7 days after surgery, and the UUO-obstructed kidneys were collected. (G, H) mRNA levels of transforming growth factor-β (Tgfβ) and tumor necrosis factor alpha (Tnfα) were measured by quantitative RT-PCR. (I) Representative images of macrophage staining. Bar: 100μm. (J) Quantification of macrophage -positive cells (n=4). Each symbol (circle, diamond and trigon) represents an independent experiment. Error bars: SEM. *p < 0.05, ***p < 0.001, ns not significant.
Figure 9
Figure 9
PARK7 translocates into nucleus and positively regulates SOD2 expression during renal fibrosis. (A, B) BUMPT cells were cultured in medium with/without 5 ng/ml TGFB1 for 24 hours. (A) Representative images of immunofluorescence staining of PARK7 in BUMPT cells. Bar:50μm. (B) Representative immunoblot of PARK7, LaminB1 (nuclear marker), and GAPDH (cytosolic marker) in cytosolic and nuclear fractions. (C, D) Animals and their treatment were the same as described in Figure 2 . (C) Representative immunoblot of SOD2 and GAPDH. (D) Densitometry of SOD2 signals (n=4). (E, F) BUMPT cells were transfected with Park7 siRNA or PARK7 overexpression plasmid. 24 hours after transfection, the cells were cultured in medium with or without 5 ng/ml TGFB1 for another 24 hours. (E) Representative immunoblot of SOD2 and GAPDH. (F) Densitometry of SOD2 signals (n=3). The signal of SOD2 was normalized to the GAPDH signal of the same samples to determine the ratios. The values are expressed as fold change over control cells. (G, H) Sod2 mRNA expression. Each symbol (circle, diamond and trigon) represents an independent experiment or an individual mouse. Error bars: SEM. *p < 0.05, **p < 0.01, ***p < 0.001.

Similar articles

Cited by

References

    1. Liu Y. Cellular and Molecular Mechanisms of Renal Fibrosis. Nat Rev Nephrol (2011) 7(12):684–96. 10.1038/nrneph.2011.149 - DOI - PMC - PubMed
    1. Venkatachalam MA, Weinberg JM, Kriz W, Bidani AK. Failed Tubule Recovery, AKI-CKD Transition, and Kidney Disease Progression. J Am Soc Nephrol (2015) 26(8):1765–76. 10.1681/asn.2015010006 - DOI - PMC - PubMed
    1. Humphreys BD. Mechanisms of Renal Fibrosis. Annu Rev Physiol (2018) 80:309–26. 10.1146/annurev-physiol-022516-034227 - DOI - PubMed
    1. Liu BC, Tang TT, Lv LL, Lan HY. Renal Tubule Injury: A Driving Force Toward Chronic Kidney Disease. Kidney Int (2018) 93(3):568–79. 10.1016/j.kint.2017.09.033 - DOI - PubMed
    1. Yang L, Besschetnova TY, Brooks CR, Shah JV, Bonventre JV. Epithelial Cell Cycle Arrest in G2/M Mediates Kidney Fibrosis After Injury. Nat Med (2010) 16(5):535–43. 10.1038/nm.2144. 531p following 143. - DOI - PMC - PubMed

Publication types

MeSH terms