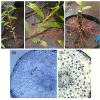
Floodwater Depth Causes Different Physiological Responses During Post-flooding in Willows
- PMID: 34093599
- PMCID: PMC8176222
- DOI: 10.3389/fpls.2021.575090
Floodwater Depth Causes Different Physiological Responses During Post-flooding in Willows
Abstract
Willows are widely planted in areas under risk of flooding. The physiological responses of willows to flooding have been characterized, but little is known about their responses during the post-flooding period. After the end of the stress episode, plants may modify some traits to compensate for the biomass loss during flooding. The aim of this work was to analyze the post-flooding physiological responses of willow under two different depths of stagnant floodwater. Cuttings of Salix matsudana NZ692 clone were planted in pots in a greenhouse. The experiment started when the plants were 2 months old with the following treatments: Control plants (watered to field capacity); plants partially flooded 10 cm above soil level (F10) and plants partially flooded 40 cm above soil level (F40). The flooding episode lasted 35 days and was followed by a recovery period of 28 days (post-flooding period). After the flooding period, height, diameter and total biomass were higher in F10, while F40 plants showed an increase in plant adventitious root production and leaf nitrogen content. During the post-flooding period, the photosynthetic rate, nitrogen, chlorophyll and soluble sugar contents were significantly higher in leaves of F40 than in Control and F10 treatments. Stomatal conductance and specific leaf area were higher in the previously flooded plants compared to Control treatment. Plants from F10 treatments showed a higher growth in height, root-to-shoot ratio, and carbon isotope discrimination than F40, while the opposite occurred for growth in diameter, vessel size and leaf area. We conclude that depth of floodwater not only causes different responses during flooding, but that its effects are also present in the post-flooding recovery period, affecting the growth and physiology of willows once the stress episode has ended. Even when flooding impacted growth negatively in F40, in the post-flooding period these plants compensated by increasing the photosynthetic rate, plant leaf area and xylem vessel size. Willows endurance to flooding is the result of both responses during flooding, and plastic responses during post-flooding.
Keywords: Salix matsudana Koidz; chlorophyll; photosynthetic rate; stomatal conductance; vessels.
Copyright © 2021 Mozo, Rodríguez, Monteoliva and Luquez.
Conflict of interest statement
The authors declare that the research was conducted in the absence of any commercial or financial relationships that could be construed as a potential conflict of interest.
Figures


Similar articles
-
Variability in flooding tolerance, growth and leaf traits in a Populus deltoides intraspecific progeny.Tree Physiol. 2020 Jan 1;40(1):19-29. doi: 10.1093/treephys/tpz128. Tree Physiol. 2020. PMID: 31860714
-
Partial flooding enhances aeration in adventitious roots of black willow (Salix nigra) cuttings.J Plant Physiol. 2006 Apr;163(6):619-28. doi: 10.1016/j.jplph.2005.06.010. Epub 2005 Aug 31. J Plant Physiol. 2006. PMID: 16545995
-
Accumulation and distribution of trivalent chromium and effects on hybrid willow (Salix matsudana Koidz x alba L.) metabolism.Arch Environ Contam Toxicol. 2007 May;52(4):503-11. doi: 10.1007/s00244-006-0155-7. Epub 2007 Mar 21. Arch Environ Contam Toxicol. 2007. PMID: 17380236
-
Erythrina speciosa (Leguminosae-Papilionoideae) under soil water saturation: morphophysiological and growth responses.Ann Bot. 2009 Sep;104(4):671-80. doi: 10.1093/aob/mcp159. Epub 2009 Jul 5. Ann Bot. 2009. PMID: 19581282 Free PMC article.
-
Riparian plant community responses to increased flooding: a meta-analysis.Glob Chang Biol. 2015 Aug;21(8):2881-90. doi: 10.1111/gcb.12921. Epub 2015 Jun 8. Glob Chang Biol. 2015. PMID: 25752818 Review.
Cited by
-
Seasonal Coloration and Ecological Adaptations of Adventitious Roots of Four Salicaceous Species in Jiuzhaigou World Natural Heritage Site, Southwestern China.Ecol Evol. 2025 Apr 15;15(4):e71218. doi: 10.1002/ece3.71218. eCollection 2025 Apr. Ecol Evol. 2025. PMID: 40242798 Free PMC article.
-
Comparative transcriptomic analysis reveals potential mechanisms for high tolerance to submergence in arbor willows.PeerJ. 2022 Feb 3;10:e12881. doi: 10.7717/peerj.12881. eCollection 2022. PeerJ. 2022. PMID: 35186476 Free PMC article.
-
Adaptation of the Invasive Plant Sphagneticola trilobata to Flooding Stress by Hybridization with Native Relatives.Int J Mol Sci. 2024 Jun 19;25(12):6738. doi: 10.3390/ijms25126738. Int J Mol Sci. 2024. PMID: 38928441 Free PMC article.
-
Modeling of the Potential Geographical Distribution of Three Fritillaria Species Under Climate Change.Front Plant Sci. 2022 Jan 10;12:749838. doi: 10.3389/fpls.2021.749838. eCollection 2021. Front Plant Sci. 2022. PMID: 35082804 Free PMC article.
-
Morphophysiological responses of Theobroma cacao L. rootstocks to flooding and post-flooding conditions.Photosynthetica. 2023 Sep 18;61(3):377-389. doi: 10.32615/ps.2023.031. eCollection 2023. Photosynthetica. 2023. PMID: 39651362 Free PMC article.
References
-
- Andralojc P. J., Bencze S., Madgwick P. J., Philippe H., Powers S. J., Shield I., et al. (2014). Photosynthesis and growth in diverse willow genotypes. Food Energy Secur. 3 69–85. 10.1002/fes3.47 - DOI
-
- Arambarri A. M. (2018). La “técnica de clarificación 5-5-5”, un método natural para el tratamiento de material vegetal. Bol. Soc. Argent. Bot. 53 579–586. 10.31055/1851.2372.v53.n4.21980 - DOI
-
- Crang R., Lyons-Sobaski S., Wise R. (2018). Plant Anatomy. Cham: Springer.
-
- Cruiziat P., Cochard H., Améglio T. (2002). Hydraulic architecture of trees: main concepts and results. Ann. For. Sci. 59 723–752.
LinkOut - more resources
Full Text Sources
Miscellaneous

