

Identification of Prognostic Biomarkers and Correlation With Immune Infiltrates in Hepatocellular Carcinoma Based on a Competing Endogenous RNA Network
- PMID: 34093635
- PMCID: PMC8173128
- DOI: 10.3389/fgene.2021.591623
Identification of Prognostic Biomarkers and Correlation With Immune Infiltrates in Hepatocellular Carcinoma Based on a Competing Endogenous RNA Network
Abstract
Background: Hepatocellular carcinoma (HCC) is one of the most common malignant tumors worldwide. Recently, competing endogenous RNAs (ceRNA) have revealed a significant role in the progression of HCC. Herein, we aimed to construct a ceRNA network to identify potential biomarkers and illustrate its correlation with immune infiltration in HCC.
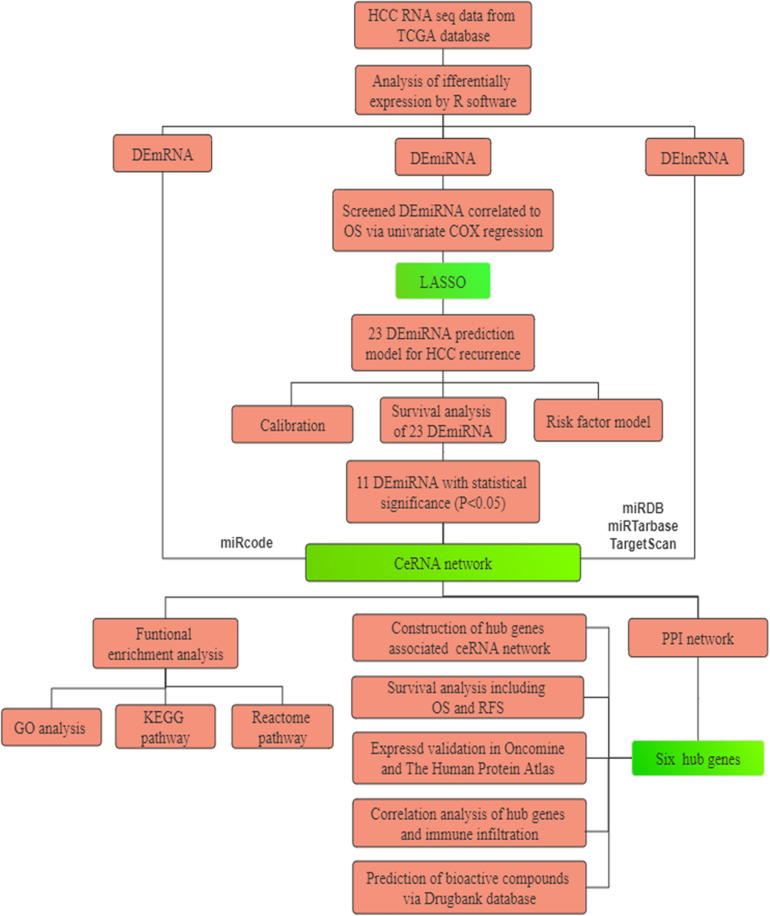
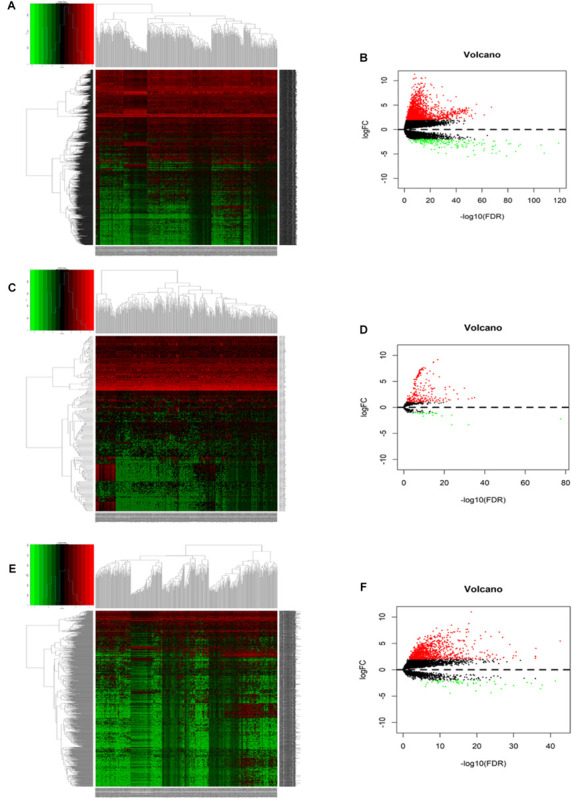
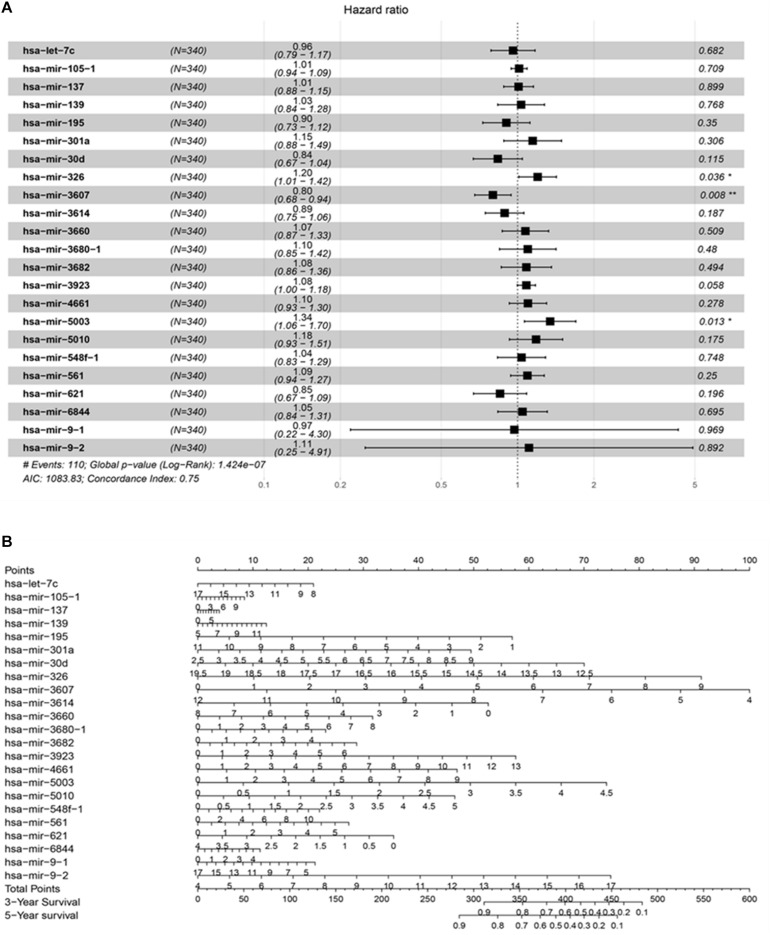
Methods: RNA sequencing data and clinical traits of HCC patients were downloaded from TCGA. The limma R package was used to identify differentially expressed (DE) RNAs. The predicted prognostic model was established using univariate and multivariate Cox regression. A K-M curve, TISIDB and GEPIA website were utilized for survival analysis. Functional annotation was determined using Enrichr and Reactome. Protein-to-protein network analysis was implemented using SRTNG and Cytoscape. Hub gene expression was validated by quantitative polymerase chain reaction, Oncomine and the Hunan Protein Atlas database. Immune infiltration was analyzed by TIMMER, and Drugbank was exploited to identify bioactive compounds.
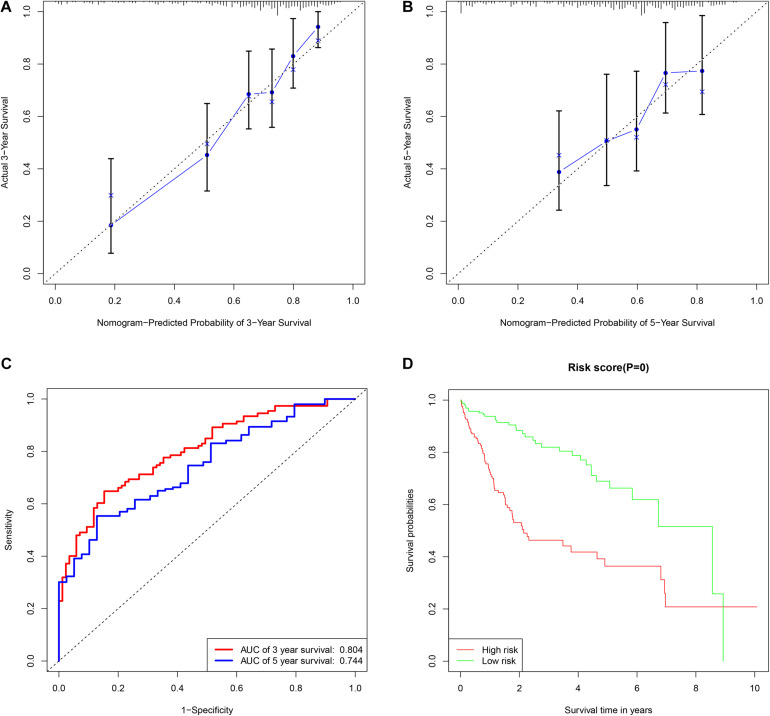
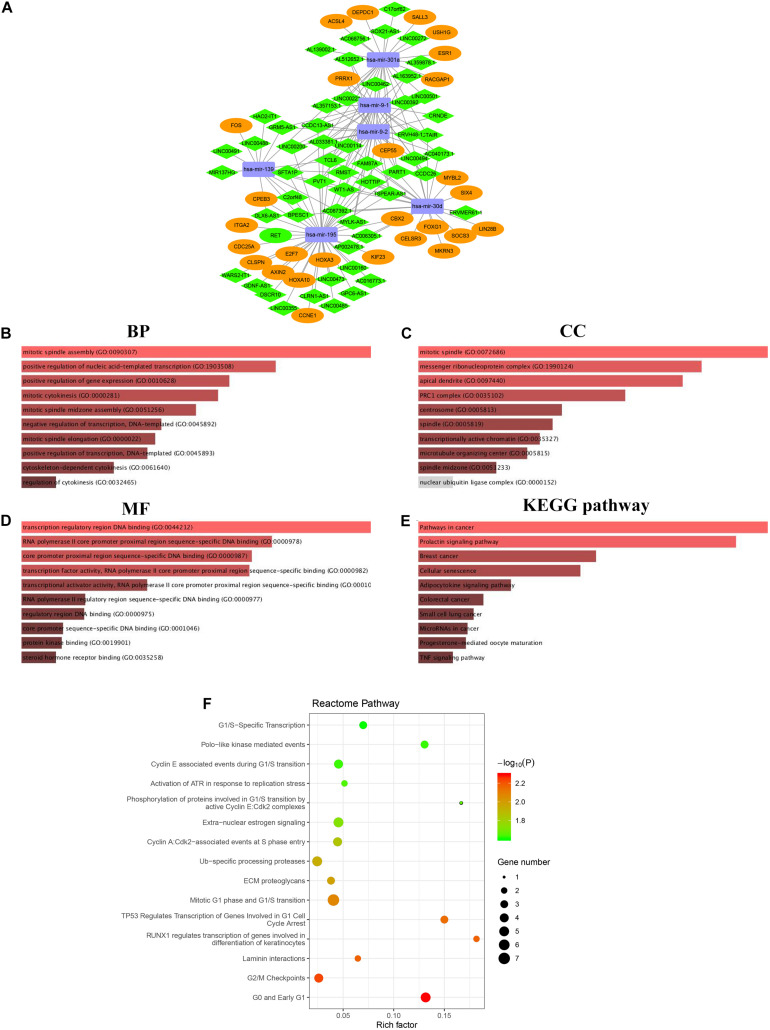
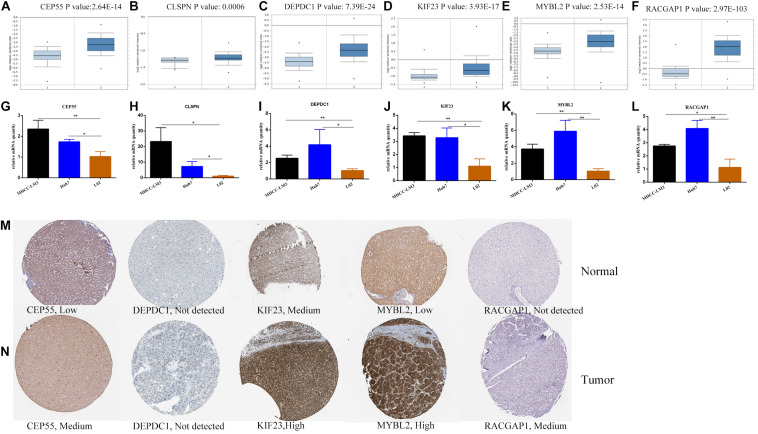
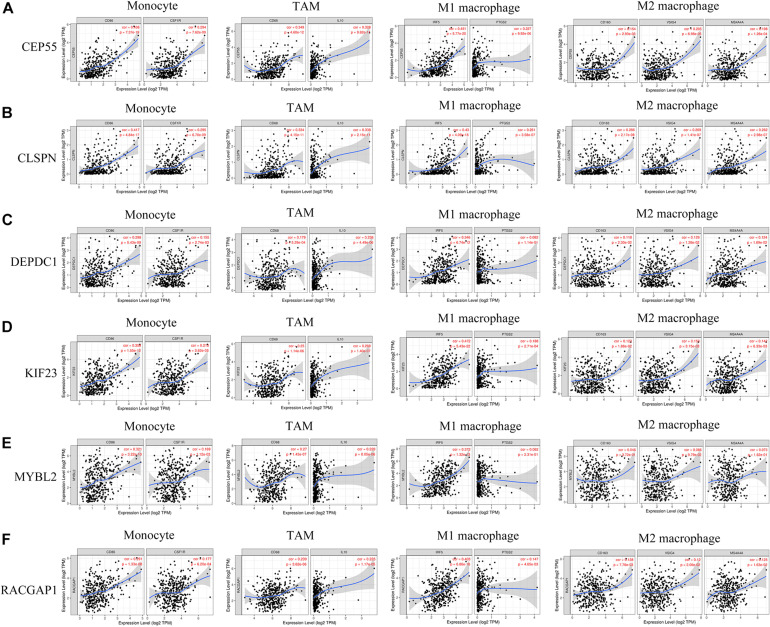
Results: The predicted model that was established revealed significant efficacy with 3- and 5-years of the area under ROC at 0.804 and 0.744, respectively. Eleven DEmiRNAs were screened out by a K-M survival analysis. Then, we constructed a ceRNA network, including 56 DElncRNAs, 6 DEmiRNAs, and 28 DEmRNAs. The 28 DEmRNAs were enriched in cancer-related pathways, for example, the TNF signaling pathway. Moreover, six hub genes, CEP55, DEPDC1, KIF23, CLSPN, MYBL2, and RACGAP1, were all overexpressed in HCC tissues and independently correlated with survival rate. Furthermore, expression of hub genes was related to immune cell infiltration in HCC, including B cells, CD8+ T cells, CD4+ T cells, monocytes, macrophages, neutrophils, and dendritic cells.
Conclusion: The findings from this study demonstrate that CEP55, DEPDC1, KIF23, CLSPN, MYBL2, and RACGAP1 are closely associated with prognosis and immune infiltration, representing potential therapeutic targets or prognostic biomarkers in HCC.
Keywords: biomarkers; competing endogenous RNA network; hepatocellular carcinoma; immune infiltration; prognostic prediction model.
Copyright © 2021 Pu, Zhu, Wang, Zhong, Peng and Zhang.
Conflict of interest statement
The authors declare that the research was conducted in the absence of any commercial or financial relationships that could be construed as a potential conflict of interest.
Figures

Similar articles
-
Construction of a ceRNA network and a genomic-clinicopathologic nomogram to predict survival for HBV-related HCC.Hum Cell. 2021 Nov;34(6):1830-1842. doi: 10.1007/s13577-021-00607-y. Epub 2021 Sep 6. Hum Cell. 2021. PMID: 34487338
-
Identification of key genes and long non-coding RNA associated ceRNA networks in hepatocellular carcinoma.PeerJ. 2019 Nov 1;7:e8021. doi: 10.7717/peerj.8021. eCollection 2019. PeerJ. 2019. PMID: 31695969 Free PMC article.
-
Reconstruction and Analysis of the Differentially Expressed IncRNA-miRNA-mRNA Network Based on Competitive Endogenous RNA in Hepatocellular Carcinoma.Crit Rev Eukaryot Gene Expr. 2019;29(6):539-549. doi: 10.1615/CritRevEukaryotGeneExpr.2019028740. Crit Rev Eukaryot Gene Expr. 2019. PMID: 32422009 Review.
-
Construction of circRNA-Based ceRNA Network to Reveal the Role of circRNAs in the Progression and Prognosis of Hepatocellular Carcinoma.Front Genet. 2021 Feb 26;12:626764. doi: 10.3389/fgene.2021.626764. eCollection 2021. Front Genet. 2021. PMID: 33719338 Free PMC article.
-
Integrated analysis of competing endogenous RNA network revealing potential prognostic biomarkers of hepatocellular carcinoma.J Cancer. 2019 Jun 2;10(14):3267-3283. doi: 10.7150/jca.29986. eCollection 2019. J Cancer. 2019. PMID: 31289599 Free PMC article.
Cited by
-
Roles of DEPDC1 in various types of cancer (Review).Oncol Lett. 2024 Aug 29;28(5):518. doi: 10.3892/ol.2024.14651. eCollection 2024 Nov. Oncol Lett. 2024. PMID: 39296974 Free PMC article. Review.
-
miR-425 regulates lipophagy via SIRT1 to promote sorafenib resistance in liver cancer.Oncol Lett. 2021 Oct;22(4):695. doi: 10.3892/ol.2021.12956. Epub 2021 Aug 2. Oncol Lett. 2021. PMID: 34457050 Free PMC article.
-
Diagnostic biomarker KIF23 is associated with immune infiltration and immunotherapy response in gastric cancer.Front Oncol. 2023 Jul 6;13:1191009. doi: 10.3389/fonc.2023.1191009. eCollection 2023. Front Oncol. 2023. PMID: 37483517 Free PMC article.
References
LinkOut - more resources
Full Text Sources
Research Materials
Miscellaneous