

Effects of Monochromatic Lighting During Incubation and Vaccination on the Splenic Transcriptome Profiles of Chicken
- PMID: 34093639
- PMCID: PMC8173116
- DOI: 10.3389/fgene.2021.628041
Effects of Monochromatic Lighting During Incubation and Vaccination on the Splenic Transcriptome Profiles of Chicken
Abstract
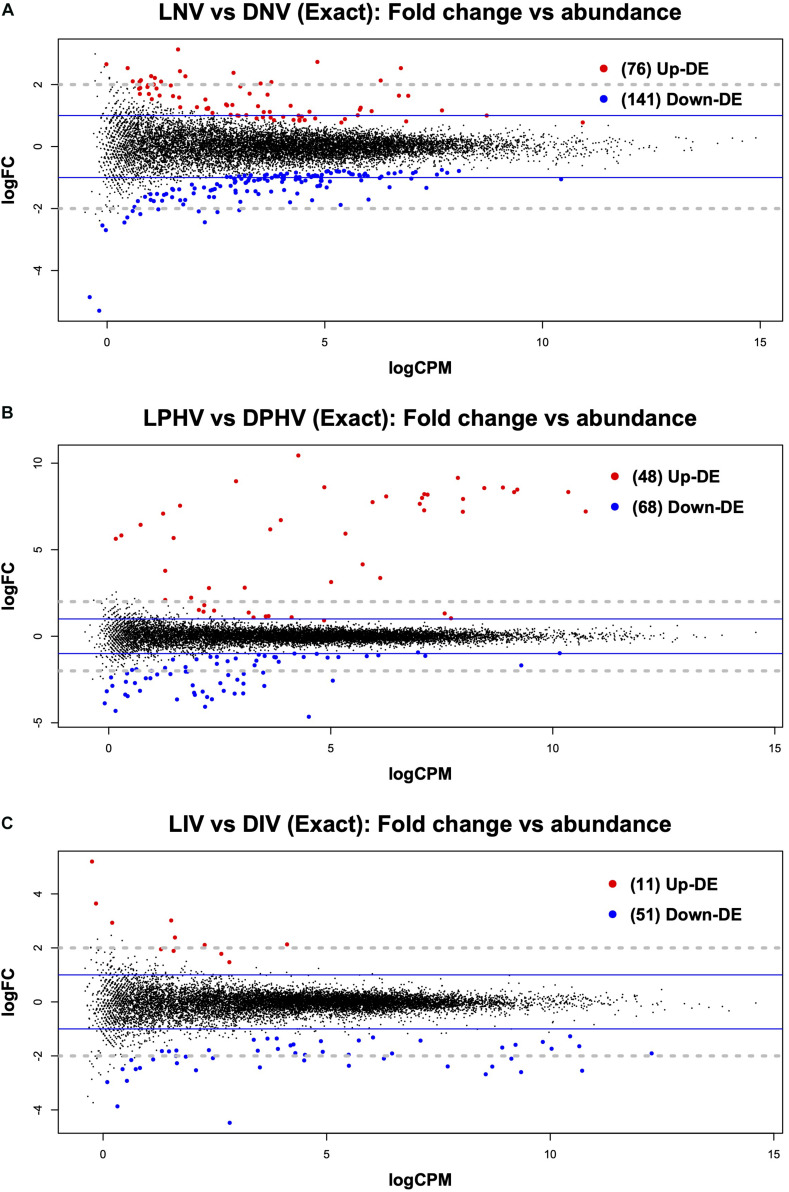
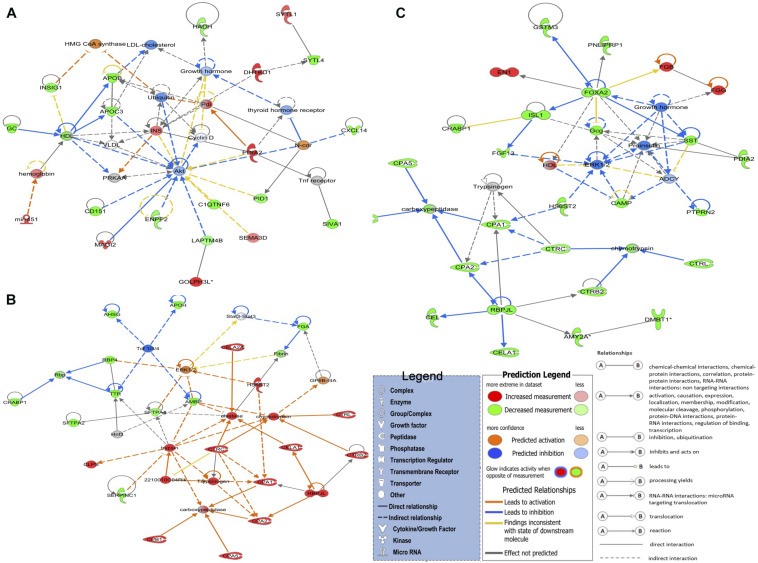
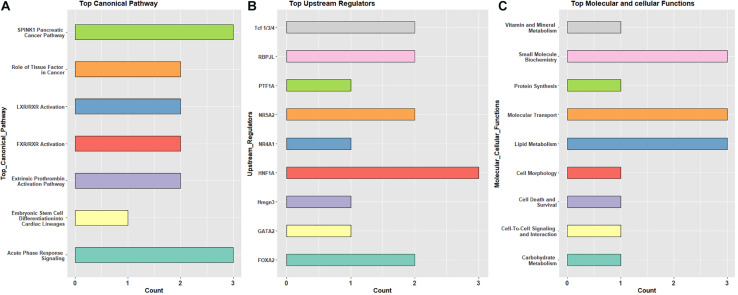
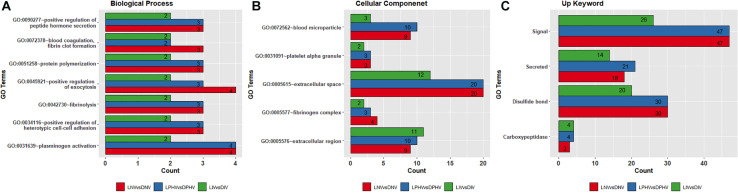
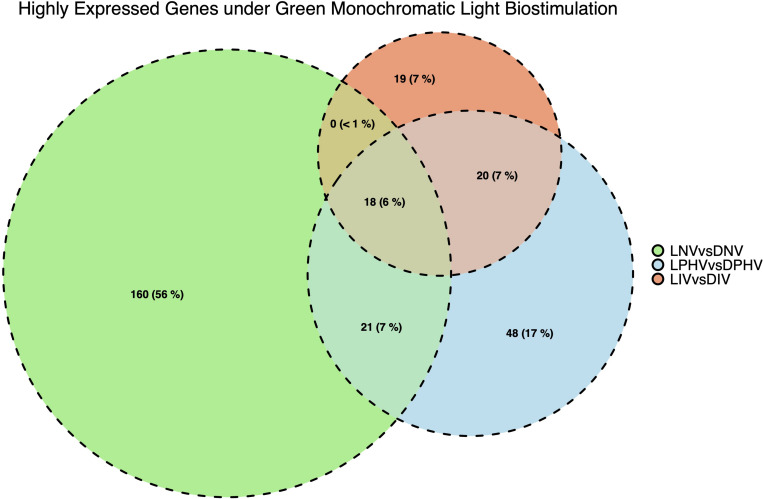
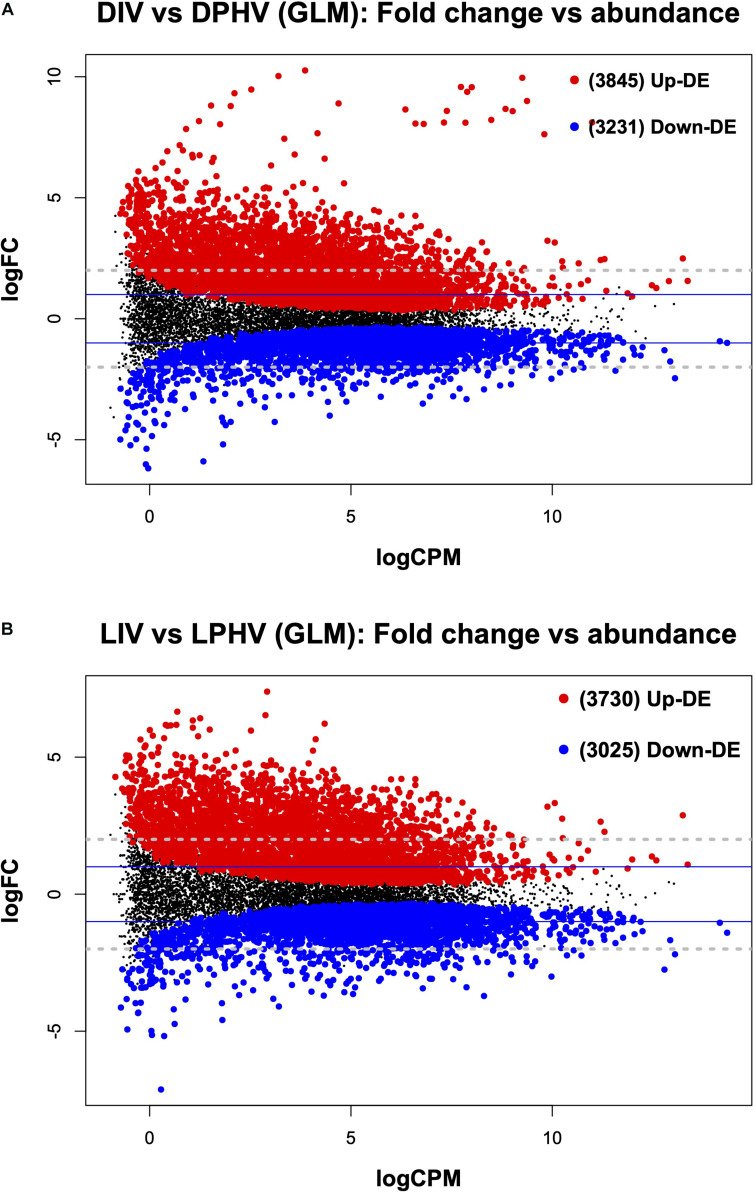
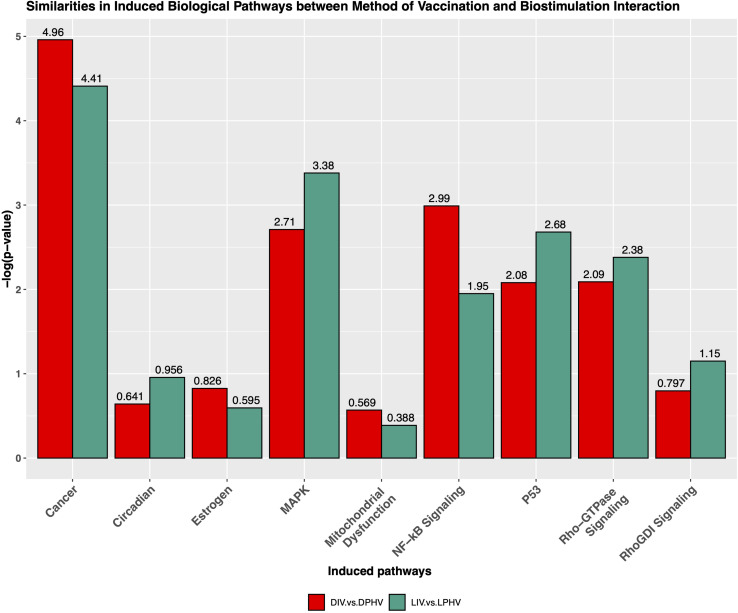
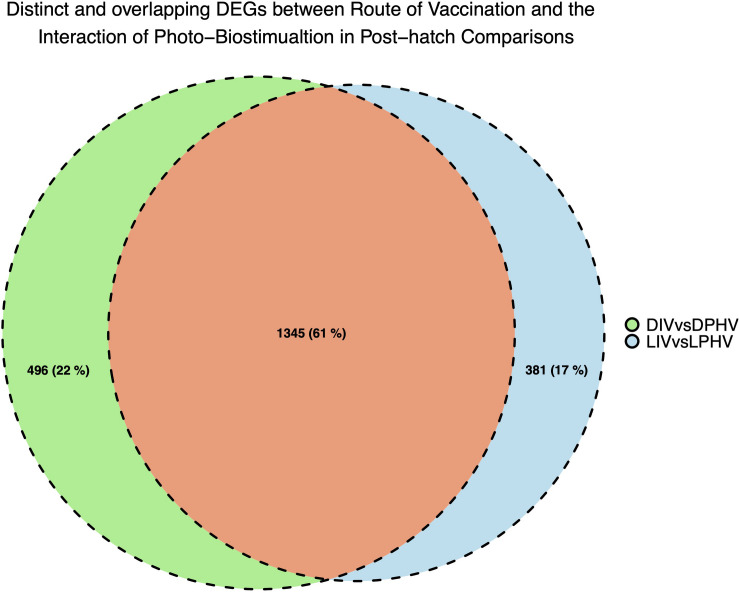
Lighting is a crucial environmental variable in poultry operations, but illumination during incubation is relatively understudied. The ability to stimulate development or immune performance using in ovo lighting is a promising approach for improving poultry health and welfare. This study investigated how monochromatic green light during incubation and vaccination method and timing affected chicken splenic gene expression patterns. We performed this study with 1,728 Hy-Line white layer eggs incubated under two light treatments during incubation: continuous dark and continuous green monochromatic light, over the entire incubation period. Half the eggs in each light treatment received in ovo vaccination, applied on embryonic day 18 (ED18). The remaining half were vaccinated by spraying on hatch day. After hatching, the light treatments followed the industry-standard lighting regimens. The study had six treatment groups with light-dark pairs for non-vaccinated, in ovo vaccinated, and post-hatch vaccinated. We assessed splenic gene expression at ED18 and at 7 days post-hatch (PH) in all the treatments. We isolated and sequenced 24 mRNA libraries on the Illumina platform, followed by bioinformatics and differential gene expression analyses. RNAseq analysis showed between 62 and 6,755 differentially expressed genes (DEGs) between comparisons, with the most prominent differences observed between ED and PH samples, followed by comparisons between vaccination methods. In contrast, light vs. dark treatments at ED showed limited effects on transcriptomic profiles. However, we observed a synergistic effect of lighting during incubation on post-hatch vaccination responses, with differentially expressed genes (DEGs) unique to the light treatment showing stimulation of cell proliferation with significance for immune activity (inferred from gene ontology terms). Gene ontology and pathway analysis indicated biological processes like cellular component organization or biogenesis, rhythmic process, developmental process, response to stimulus, and immune system processes were explained by the DEGs. While lighting is an important source of circadian stimulation, other controlled studies are required to clarify whether in ovo circadian entrainment plays a role in modulating immune responses.
Keywords: Newcastle disease; incubation; monochromatic lighting; poultry; spleen; transcriptome; vaccination.
Copyright © 2021 Ibrahim, Nelson, Archer and Athrey.
Conflict of interest statement
The authors declare that the research was conducted in the absence of any commercial or financial relationships that could be construed as a potential conflict of interest.
Figures
Similar articles
-
Incubation Temperature and Lighting: Effect on Embryonic Development, Post-Hatch Growth, and Adaptive Response.Front Physiol. 2022 May 13;13:899977. doi: 10.3389/fphys.2022.899977. eCollection 2022. Front Physiol. 2022. PMID: 35634161 Free PMC article. Review.
-
The effect of selected in ovo green light photostimulation periods on post-hatch broiler growth and somatotropic axis activity.Poult Sci. 2021 Aug;100(8):101229. doi: 10.1016/j.psj.2021.101229. Epub 2021 Apr 30. Poult Sci. 2021. PMID: 34161851 Free PMC article.
-
The effect of monochromatic photostimulation on growth and development of broiler birds.Gen Comp Endocrinol. 2013 Sep 1;190:214-9. doi: 10.1016/j.ygcen.2013.06.027. Epub 2013 Jul 15. Gen Comp Endocrinol. 2013. PMID: 23867228
-
Effects of lighting schedule during incubation of broiler chicken embryos on leg bone development at hatch and related physiological characteristics.PLoS One. 2019 Aug 15;14(8):e0221083. doi: 10.1371/journal.pone.0221083. eCollection 2019. PLoS One. 2019. PMID: 31415653 Free PMC article.
-
Comparison of in ovo and post-hatch vaccination with particular reference to infectious bursal disease. A review.Vet Q. 2004 Jun;26(2):76-87. doi: 10.1080/01652176.2004.9695170. Vet Q. 2004. PMID: 15230052 Review.
Cited by
-
Effects of Different Photoperiods during Incubation on Post-Hatch Broiler Performance and Stress Response.Vet Sci. 2024 Sep 9;11(9):418. doi: 10.3390/vetsci11090418. Vet Sci. 2024. PMID: 39330797 Free PMC article.
-
Investigation regarding the effects of different monochromatic lights on lipid metabolism and immune function in chickens.Poult Sci. 2025 Aug;104(8):105291. doi: 10.1016/j.psj.2025.105291. Epub 2025 May 12. Poult Sci. 2025. PMID: 40403548 Free PMC article.
-
Recent developments and future directions in meta-analysis of differential gene expression in livestock RNA-Seq.Front Genet. 2022 Sep 19;13:983043. doi: 10.3389/fgene.2022.983043. eCollection 2022. Front Genet. 2022. PMID: 36199583 Free PMC article. Review.
-
Gut Microbiome-Brain Crosstalk in the Early Life of Chicken Reveals the Circadian Regulation of Key Metabolic and Immune Signaling Processes.Microorganisms. 2025 Mar 30;13(4):789. doi: 10.3390/microorganisms13040789. Microorganisms. 2025. PMID: 40284627 Free PMC article.
-
Incubation Temperature and Lighting: Effect on Embryonic Development, Post-Hatch Growth, and Adaptive Response.Front Physiol. 2022 May 13;13:899977. doi: 10.3389/fphys.2022.899977. eCollection 2022. Front Physiol. 2022. PMID: 35634161 Free PMC article. Review.
References
-
- Archer G. S. (2015). Timing of light exposure during incubation to improve hatchability, chick quality and post-hatch well-being in broiler chickens: 21 or 18 days. Int. J. Poult. Sci. 14 293–299. 10.3923/ijps.2015.293.299 - DOI
LinkOut - more resources
Full Text Sources