. 2021 May 5;12(13):3781-3795.
doi: 10.7150/jca.51332. eCollection 2021.

INSL4 as prognostic marker for proliferation and invasiveness in Non-Small-Cell Lung Cancer

Affiliations

INSL4 as prognostic marker for proliferation and invasiveness in Non-Small-Cell Lung Cancer

Damiano Scopetti et al. J Cancer. .

Abstract

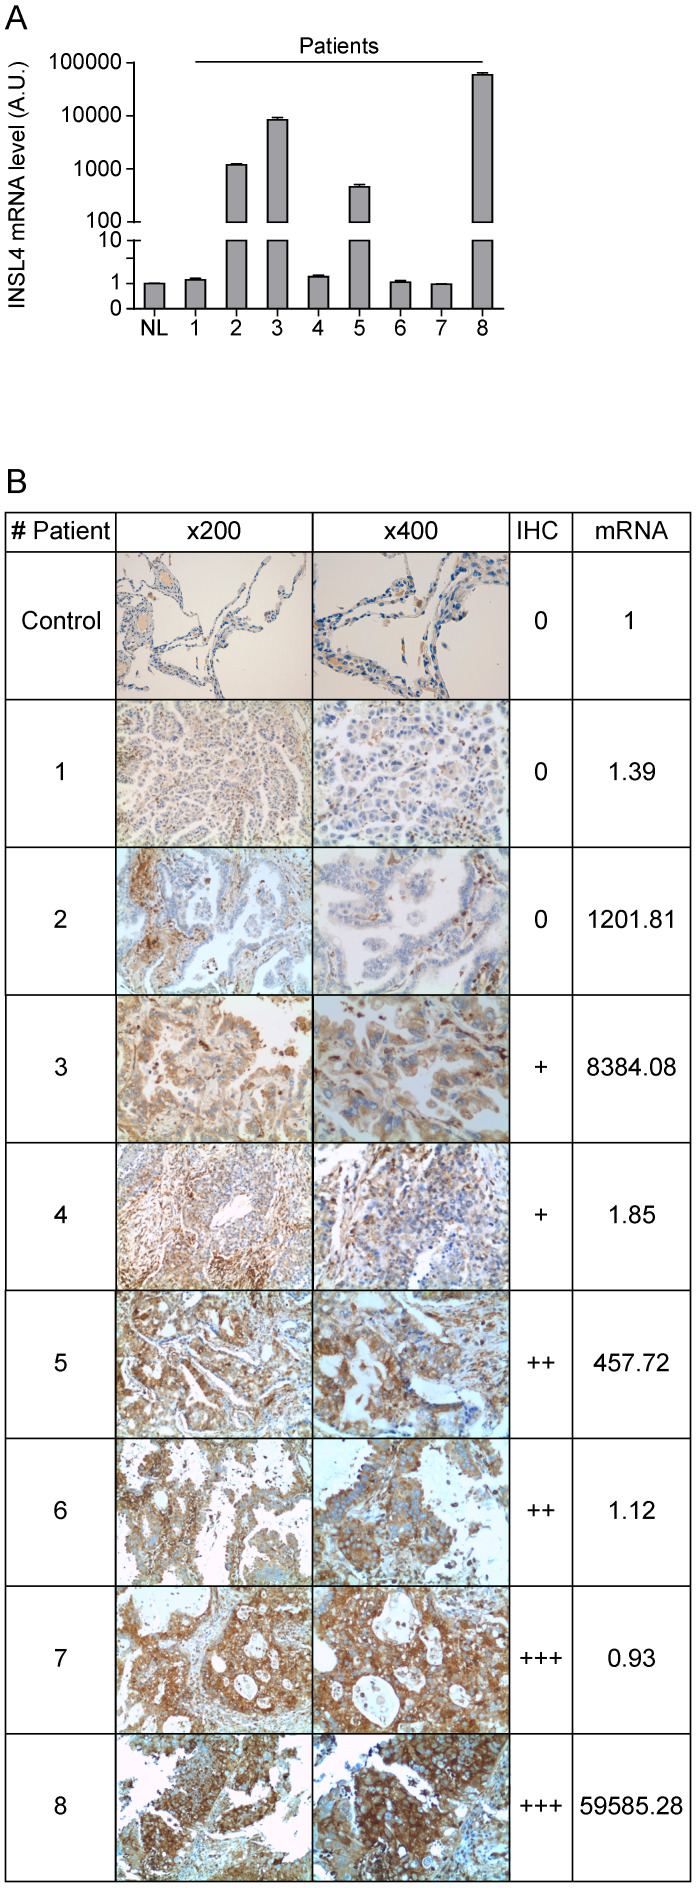
Non-small-cell-lung cancer accounts for 80-85% of all forms of lung cancer as leading cause of cancer-related death in human. Despite remarkable advances in the diagnosis and therapy of lung cancer, no significant improvements have thus far been achieved in terms of patients' prognosis. Here, we investigated the role of INSL4 - a member of the relaxin-family - in NSCLC. We overexpressed INSL4 in NSCLC cells to analyse in vitro the growth rate and the tumourigenic features. We investigated the signalling pathways engaged in INSL4 overexpressing cells and the tumour growth ability by studying the tumour development in a patient derived tumour xenograft mouse model. We found an INSL4 cell growth promoting effect in vitro in H1299 cells and in vivo in NOD/SCID mice. Surprisingly, in NSCLC-A549 cells, INSL4 overexpression has not similar effect, despite huge basal INSL4-mRNA expression respect to H1299. The INSL4-mRNA analysis of eight different NSCLC-derived cell lines, revealed highly difference in the INSL4-mRNA amount. Transfection of NSCLC lines with INSL4-Myc showed huge level of INSL4-mRNA with a very low amount of protein expressed. Notably, similar discrepancy has been observed in NSCLC patients. However, in a cohort of NSCLC patients analysing a database, we found a significant inverse correlation between INSL4 expression and Overall Survival. By combining the in vitro and in vivo results, suggest that in patients whose NSCLC adenocarcinoma spontaneously expressed high levels of INSL4 post-transcriptional modifications affecting INSL4 do not allow to assess precision therapy in selected patients without consider protein INSL4 amount.

Keywords: INSL4; NSCLC adenocarcinoma; invasiveness; proliferation; xenograft mouse.


Conflict of interest statement

Competing Interests: The authors have declared that no competing interest exists.

Figures

Figure 1
Figure 1
INSL4 structure and localization in NSCLC H1299. A, Schematic diagram of INSL4 gene and protein (left) and bioinformatics prediction for SignalP-5.0 (right). B, Representative images of the immunofluorescence analysis of INSL4 transfected H1299 cells 48 or 72 hours after transfection. Cells were fixed and stained with antibodies to the fusion protein INSL4-Myc-Tag (INSL4), and calreticulin and revealed using the appropriate secondary antibodies. Nuclei were DAPI stained. C, Representative images of the immunofluorescence analysis of not permeabilized INSL4 transfected H1299 cells at 72 hours of transfection. Cells were stained using antibody to INSL4-Myc-Tag (anti myc-Tag) as previously. Nuclei were DAPI stained. Samples were analyzed under fluorescent microscope. D, Representative images of the immunofluorescence analysis on INSL4 transfected H1299 cells labeled using phalloidin-FITC conjugate (Phalloidin) as cytoskeleton marker and anti Myc-Tag for INSL4 detection. Nuclei were DAPI stained. Samples were analyzed under fluorescent microscope. Representative images of three independent experiments are shown. Scale bars 10 µm.
Figure 2
Figure 2
INSL4 role in NSCLC proliferation and invasiveness in H1299 cells. Representative images of each analysis are shown. A, Cell growth assay was performed in H1299 stably expressing a control vector (Control) and H1299-INSL4 (INSL4) cells. B, Mitotic index in H1299 (Control) and H1299-INSL4 cells (INSL4). Two hundred cells were scored for mitoses by immunofluorescence analysis. Results were shown as percentage of mitotic cells. Results are presented as means ± SEM. Nuclei were DAPI stained. Scale bars 10 µm. C, Cell cycle profiles of H1299 (Control) and H1299-INSL4 cells (INSL4) determined by FACS analysis. Graph illustrates the cell percentage in the different cell cycle phases. Results are presented as means ± SEM. D, Colony formation assay in H1299 (Control) and H1299-INSL4 cells. Cells were stained with crystal violet. E, Soft agar assay in H1299-control and H1299-INSL4 cells. The graph illustrates the score of twenty randomly selected fields. F, Immunofluorescence analysis in H1299 (Control) and H1299-INSL4 cells was performed using phalloidin-FITC conjugate (Phalloidin) as cytoskeleton marker and anti-Myc-Tag for protein INSL4-Myc-Tag detection (INSL4), and revealed using the appropriate secondary antibodies. Nuclei were DAPI stained. Scale bars 10 μm. G, Wound healing assay in H1299 (Control) and H1299-INSL4 cells (INSL4). The graph illustrates the percentage of residual wound healing area at 0, 6 and 24 hours from injury. H, Analysis of activation signaling pathways for proliferation was performed by western blotting on H1299 (Control) and H1299-INSL4 cells using the indicated antibodies. Results are presented as means ± SEM. *, P<0.05; **, P<0.01; ***, P <0.001. All the images are representative of three independent experiments.
Figure 3
Figure 3
INSL4 influence tumour growth. A, H1299 cells engraftment in mice. NOD/SCID mice (n=4 per group) were subcutaneously injected using H1299 (Control) or H1299-INSL4 (INSL4) cells as described. Tumour growth progression is displayed in graph. Volume of each mass (n=4 per condition) is recorded every five days after cellular injection and reported in graph as means ± SEM. Representative pictures showed the external view of tumour-bearing NOD/SCID mice and the in situ and post-explantation tumour masses. B, H&E staining of xenograft tumour. Thirty randomly selected slides were scored for mitoses. The shows the mitotic index. The results are presented as means ± SEM of percentage of mitotic cells. C, H&E staining of xenograft tumors shows extensive necrotic areas in INSL4 masses relative to Control. Scale bars 10 µm. D, Ki67 staining in xenograft tumors. The graph displays the percentage of Ki67 positive cells. Thirty randomly selected slides were scored. Results are presented as means ± SEM. E, Pathways activation in xenograft induction was performed by Western Blotting analyses in lysates from tumour masses using the indicate antibodies. *, P<0.05; **, P<0.01; ***, P <0.001. All the images are representative of three independent experiments.
Figure 4
Figure 4
INSL4 role in NSCLC proliferation and invasiveness in A549 cells and INSL4 mRNA and INSL4-Myc-Tagged protein expression. A, Cell growth assay was performed in A549 stably expressing a control vector (Control) or INSL4 (INSL4). B, Colony formation assay in A549-control and A549-INSL4 cells. Cells were stained with crystal violet. C, Soft agar assay in A549 (Control) and A549-INSL4 cells (INSL4). The graph illustrates the score of twenty randomly selected fields. Results are presented as means ± SEM. *, P<0.05; **, P<0.01; ***, P <0.001. All the images are representative of three independent experiments. D, INSL4 mRNA levels were studied using qPCR analysis in the reported H1299 and A549 cells assuming the amount of INSL4 mRNA of H1299 as Arbitrary Unit (A.U.) 1 (left). INSL4 protein levels on the same NSCLC cell lines were studied by immunoblot analysis using anti-INSL4 antibody. Anti-Tubulin antibody is loading used as control. In graphical representation relative H1299 INSL4 protein level was assumed as Arbitrary Units (A.U.) 1 (right). E, INSL4 mRNA levels were studied using qPCR analysis in the reported tumour cell lines assuming the amount of INSL4 mRNA of H1299 as Arbitrary Unit (A.U.) in the graph. F, Levels of endogenous and transfected INSL4 mRNA in H1299, A549, H460 NSCLC cell lines transfected with fusion protein INSL4-Myc-Tag and pcDNA3.1 (control), the absolute mRNA levels were compared to mRNA levels in H1299 WT. G, INSL4 protein levels on the same NSCLC cell lines showed in F were studied by immunoblot analysis using anti-Myc antibody. All the images are representative of three independent experiments.
Figure 5
Figure 5
INSL4 mRNA and protein expression in lung cancer tissues. A, INSL4 mRNA levels were studied using qPCR analysis in the specimens of patients (indicated 1 to 8) with NSCLC and in normal lung (NL) assuming the amount of INSL4 mRNA as an Arbitrary Unit (A.U.) 1. B, Immunohistochemistry for INSL4 protein levels in the specimens examined for qPCR analysis. Samples were categorized with different grade of positivity for immunohistochemistry. Immunohistochemistry range of positivity is from 0 to +++, NL is used for control. INSL4 mRNA values were reported in the last right column and refer to the images of relative histological samples. Magnification x200 and x400. INSL4 mRNA values were reported in the last right column and refer to the images of relative histological samples. Magnification x200 and x400.
Figure 6
Figure 6
INSL4 mRNA expression in patients with tumour and its prognostic value. A, Extended INSL4 mRNA expression pattern across normal and cancer tissues was assessed using the GENT2 database. Arrow indicates lung tissue (Lung-C: lung cancer; Lung-N: normal lung). B, INSL4 expression pattern across normal lung and NSCLC tissues in U133Plus2.0 data set. A-B, refer to the 75th percentile, median and 25th percentile; dots refer to individual values. C-E, Kaplan-Meier plots for the whole cohort of NSCLC patients. The graphs plots were obtained using Kaplan-Meier -plot database and illustrate the prognostic effect of high and low expression of INSL4 in patients with lung cancer. OS= Overall Survival; FP= First Progression, PPS= Post Progression Survival (C) in NSCLC: OS (n=1936, P=0.00094, HR=1.24), FP (n=982, P=6.8e-08, HR= 1.7), and PPS (n=344, P=0.017, HR=1.36). D, in AC-NSCLC: OS (n=721, P=0.0019, HR=1.44), FP (n=461, P=0.14, HR= 1.26), and PPS (n=125, P=0.018, HR=1.75). E, in squamous carcinoma-NSCLC (SCC-NSCLC): OS (n=141, P=0.01, HR=1.54), FP (n=524, P=0.58, HR= 1.07), and PPS (n=20, P=0.81, HR=1.13). n= patient cohort.

Similar articles

Cited by

References

    1. Molina JR, Yang P, Cassivi SD. et al. Non-small cell lung cancer: epidemiology, risk factors, treatment, and survivorship. Mayo Clinic proceedings. 2008;83:584–94. - PMC - PubMed
    1. Navada S, Lai P, Schwartz AG, Kalemkerian GP. Temporal trends in small cell lung cancer: Analysis of the national Surveillance, Epidemiology, and End-Results (SEER) database. J Clin Oncol. 2006;24:384s–s.
    1. Siegel R, Naishadham D, Jemal A. Cancer statistics, 2012. CA: a cancer journal for clinicians. 2012;62:10–29. - PubMed
    1. Torre LA, Bray F, Siegel RL. et al. Global cancer statistics, 2012. CA: a cancer journal for clinicians. 2015;65:87–108. - PubMed
    1. Ding L, Getz G, Wheeler DA. et al. Somatic mutations affect key pathways in lung adenocarcinoma. Nature. 2008;455:1069–75. - PMC - PubMed