. 2021 May 5;12(13):3887-3899.
doi: 10.7150/jca.51467. eCollection 2021.

High SEC61G expression predicts poor prognosis in patients with Head and Neck Squamous Cell Carcinomas

Affiliations

High SEC61G expression predicts poor prognosis in patients with Head and Neck Squamous Cell Carcinomas

Leifeng Liang et al. J Cancer. .

Abstract

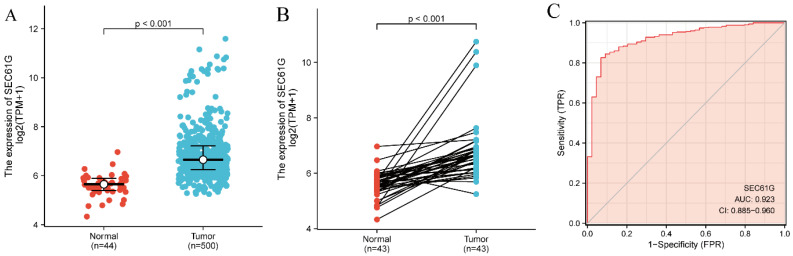
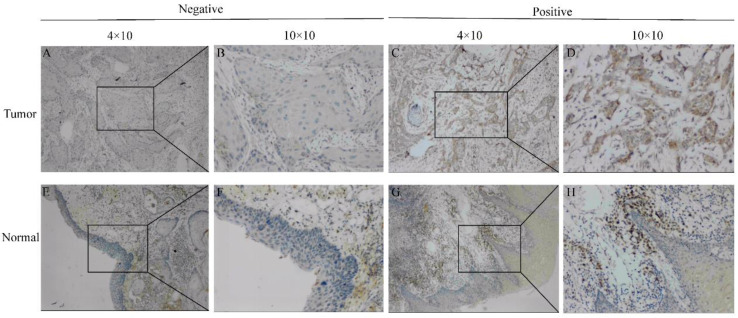
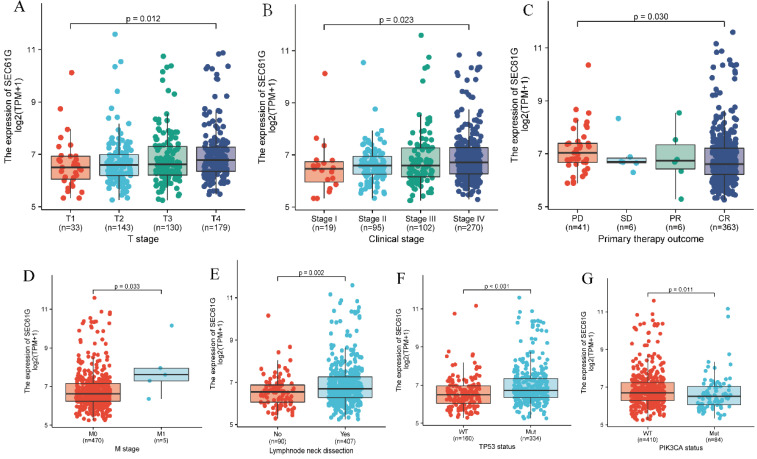
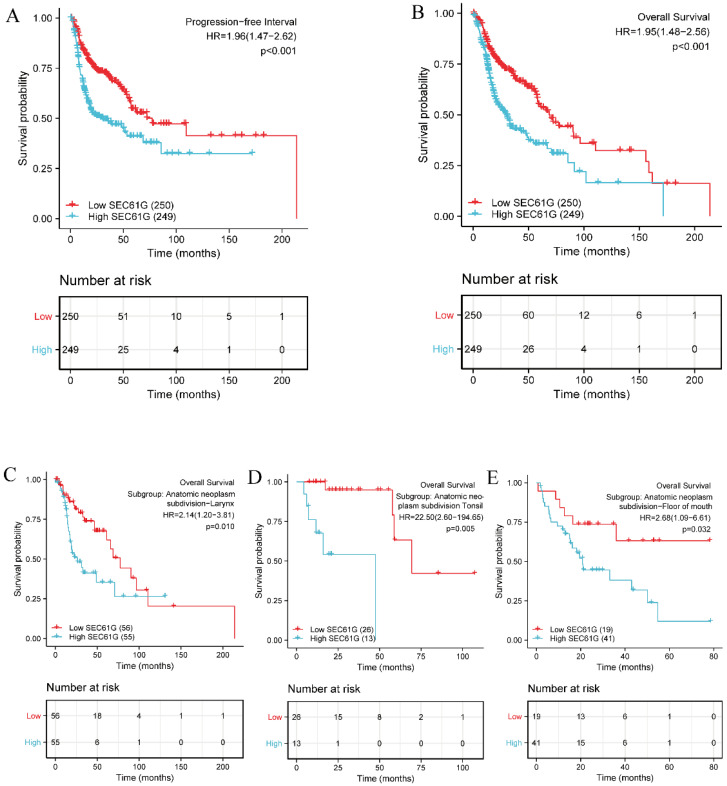
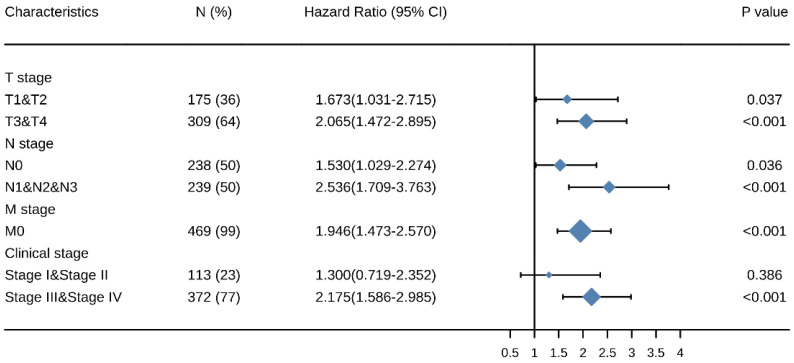
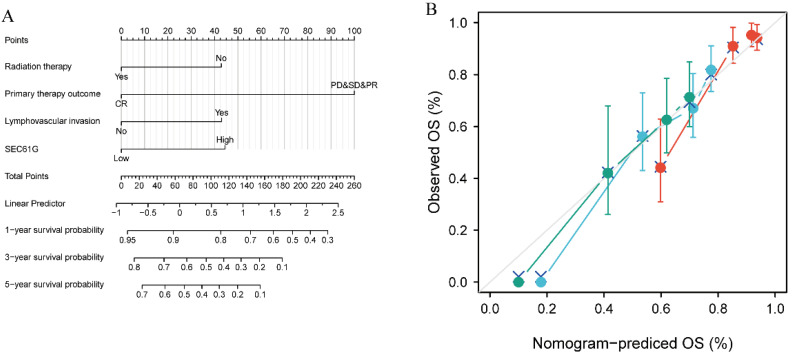
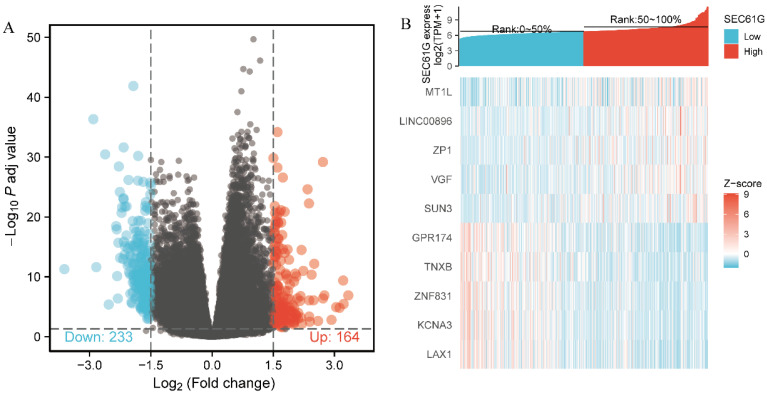
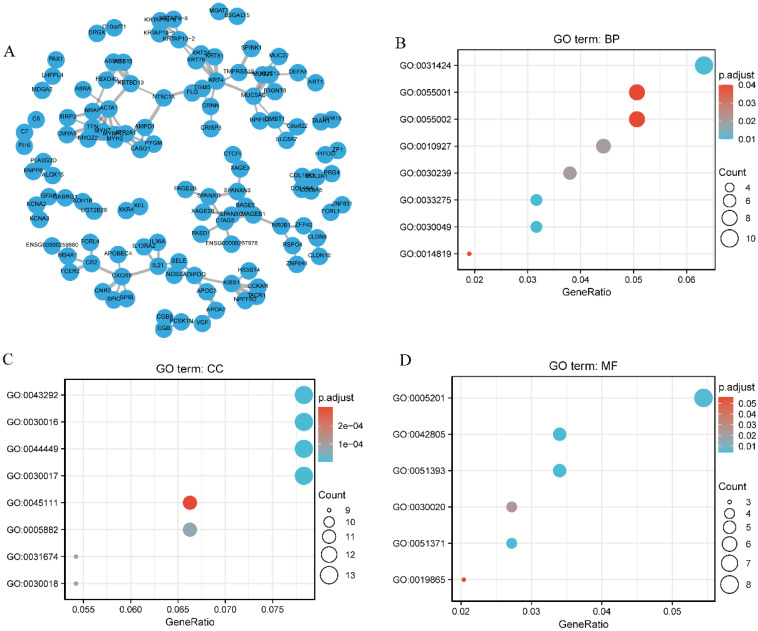
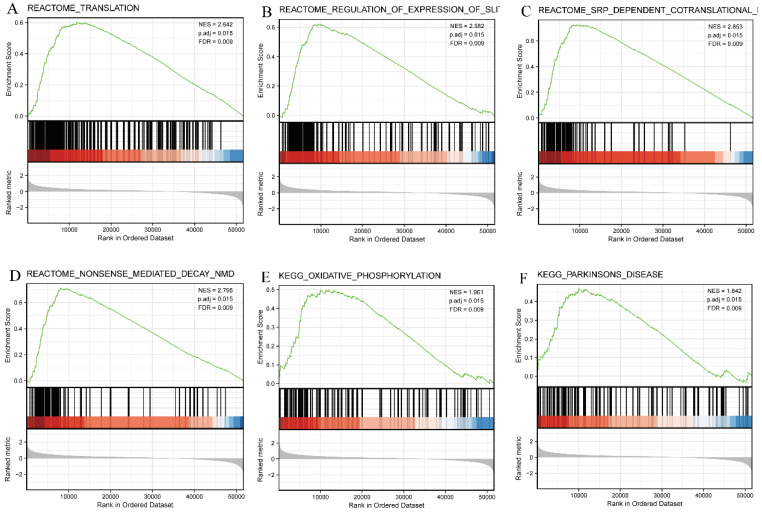
Background: Overexpression of the membrane protein SEC61 translocon gamma subunit (SEC61G) has been observed in a variety of cancers; however, its role in head and neck squamous cell carcinomas (HNSCC) is unknown. This study aimed to elucidate the relationship between SEC61G and HNSCC based on data from The Cancer Genome Atlas (TCGA) database. Methods: Data for HNSCC patients were collected from TCGA and the expression level of SEC61G was compared between paired HNSCC and normal tissues using the Wilcoxon rank-sum test. The relationship between clinicopathologic features and SEC61G expression was also analyzed using the Wilcoxon rank-sum test and logistic regression. Receiver operating characteristic (ROC) curves were generated to evaluate the value of SEC61G as a binary classifier using the area under the curve (AUC value). The association of clinicopathologic characteristics with prognosis in HNSCC patients was assessed using Cox regression and the Kaplan-Meier methods. A nomogram, based on Cox multivariate analysis, was used to predict the impact of SEC61G on prognosis. Functional enrichment analysis was performed to determine the hallmark pathways associated with differentially expressed genes in HNSCC patients exhibiting high and low SEC61G expression. Results: The expression of SEC61G was significantly elevated in HNSCC tissues compared to normal tissues (P < 0.001). The high expression of SEC61G was significantly correlated with the T stage, M stage, clinical stage, TP53 mutation status, PIK3CA mutation status, primary therapy outcome, and cervical lymph node dissection (all P < 0.05). Meanwhile, ROC curves suggested the significant diagnostic ability of SEC61G for HNSCC (AUC = 0.923). Kaplan-Meier survival analysis showed that patients with HNSCC characterized by high SEC61G expression had a poorer prognosis than patients with low SEC61G expression (hazard ratio = 1.95, 95% confidence interval 1.48-2.56, P < 0.001). Univariate and multivariate analyses revealed that SEC61G was independently associated with overall survival (P = 0.027). Functional annotations indicated that SEC61G is involved in pathways related to translation and regulation of SLITs/ROBOs expression, SRP-dependent co-translational protein targeting to the membrane, nonsense-mediated decay, oxidative phosphorylation, and Parkinson's disease. Conclusion: SEC61G plays a vital role in HNSCC progression and prognosis; it may, therefore, serve as an effective biomarker for the prediction of patient survival.

Keywords: SEC61G; biomarker; head and neck squamous cell carcinoma; prognosis.


Conflict of interest statement

Competing Interests: The authors have declared that no competing interest exists.

Figures

Figure 1
Figure 1
SEC61G expression between cancer and normal tissues in HNSCC patients (A) SEC61G expression levels in HNSCC and matched normal tissues. (B) SEC61G expression levels in HNSCC and matched normal tissues. (C) ROC analysis of SEC61G shows promising discrimination power between tumor and normal tissues.
Figure 2
Figure 2
Representative images of SEC61G expression in tongue cancer tissues and their normal controls. (A, B) Negative or (C, D) positive staining for SEC61G in tongue cancer tissues. (E, F) Negative or (G, H) positive staining for SEC61G in normal tissues. Original magnifications 40× and 100× (inset panels).
Figure 3
Figure 3
Association of SEC61G expression with clinicopathologic characteristics. (A) T stage; (B) clinical stage; (C) primary therapy outcome; (D) M stage; (E) lymph node neck dissection; (F) TP53 mutation status; (G) PIK3CA mutation status.
Figure 4
Figure 4
Kaplan-Meier survival curves comparing the high and low expression of SEC61G in HNSCC patients. (A) Progression-free interval. (B) Overall survival. (C-E) Overall survival for subgroup analyses in different HNSCC anatomical sites: larynx (C), tonsil (D), and floor of mouth cancer (E).
Figure 5
Figure 5
Multivariate survival analysis of overall survival probabilities concerning SEC61G expression in patients of different subgroups according to cancer stage.
Figure 6
Figure 6
Relationship between SEC61G and other clinical factors with overall survival (OS). (A) Nomogram for predicting the probability of 1-, 3-, and 5-year OS for HNSCC patients. (B) Calibration plot of the nomogram for predicting the OS likelihood.
Figure 7
Figure 7
Differentially expressed genes between patients with high and low SEC61G expression. (A) Volcano plot of differentially expressed genes between the high and low SEC61G expression groups. Normalized expression levels are shown in descending order from green to red. (B) Heatmap of the top ten significant differentially expressed genes between the high and low SEC61G expression groups. Green and red dots represent downregulated and upregulated genes, respectively.
Figure 8
Figure 8
Protein-protein interaction network and functional enrichment analysis. (A) Protein-protein interaction network of SEC61G and its co-expressed genes. (B) Enriched GO terms in the “biological process” category. (C) Enriched GO terms in the “cellular component” category. (D) Enriched GO terms in the “molecular function” category. The x-axis represents the proportion of differentially expressed genes (DEGs) and the y-axis represents different categories. Blue and red tones represent adjusted P values from 0.0 to 0.05, respectively, and different circle sizes represent the number of DEGs.
Figure 9
Figure 9
Enrichment plots from GSEA. Several pathways were differentially enriched in HNSCC patients according to high and low SEC61G expression. (A) Translation. (B) Regulation of the SLITs/ROBOs pathway expression. (C) SRP-dependent co-translational protein targeting the membrane. (D) Nonsense-mediated decay pathway. (E) Oxidative phosphorylation. (F) Parkinson disease. ES, enrichment score; NES, normalized enrichment score; ADJ p-Val, adjusted P-value; FDR, false discovery rate.
Figure 10
Figure 10
Correlations between the relative abundance of 24 immune cells and SEC61G expression levels. The size of the dots represents the absolute Spearman's correlation coefficient values.

Similar articles

Cited by

References

    1. Siegel RL, Miller KD, Jemal A. Cancer statistics, 2019. CA: a cancer journal for clinicians. 2019;69:7–34. - PubMed
    1. Zhang W, Han Y, Li W, Cao L, Yan L, Qin C. et al. Clinical data analysis reveals the role of OGR1 (GPR68) in head and neck squamous cancer. Animal models and experimental medicine. 2020;3:55–61. - PMC - PubMed
    1. Yu B, Zhang Y, Wu K, Wang L, Jiang Y, Chen W. et al. CD147 promotes progression of head and neck squamous cell carcinoma via NF-kappa B signaling. Journal of cellular and molecular medicine. 2019;23:954–66. - PMC - PubMed
    1. Economopoulou P, de Bree R, Kotsantis I, Psyrri A. Diagnostic Tumor Markers in Head and Neck Squamous Cell Carcinoma (HNSCC) in the Clinical Setting. Front Oncol. 2019;9:827. - PMC - PubMed
    1. Hartmann E, Sommer T, Prehn S, Görlich D, Jentsch S, Rapoport TA. Evolutionary conservation of components of the protein translocation complex. Nature. 1994;367:654–7. - PubMed