

Alterations of bacterial communities of vocal cord mucous membrane increases the risk for glottic laryngeal squamous cell carcinoma
- PMID: 34093809
- PMCID: PMC8176248
- DOI: 10.7150/jca.54221
Alterations of bacterial communities of vocal cord mucous membrane increases the risk for glottic laryngeal squamous cell carcinoma
Abstract
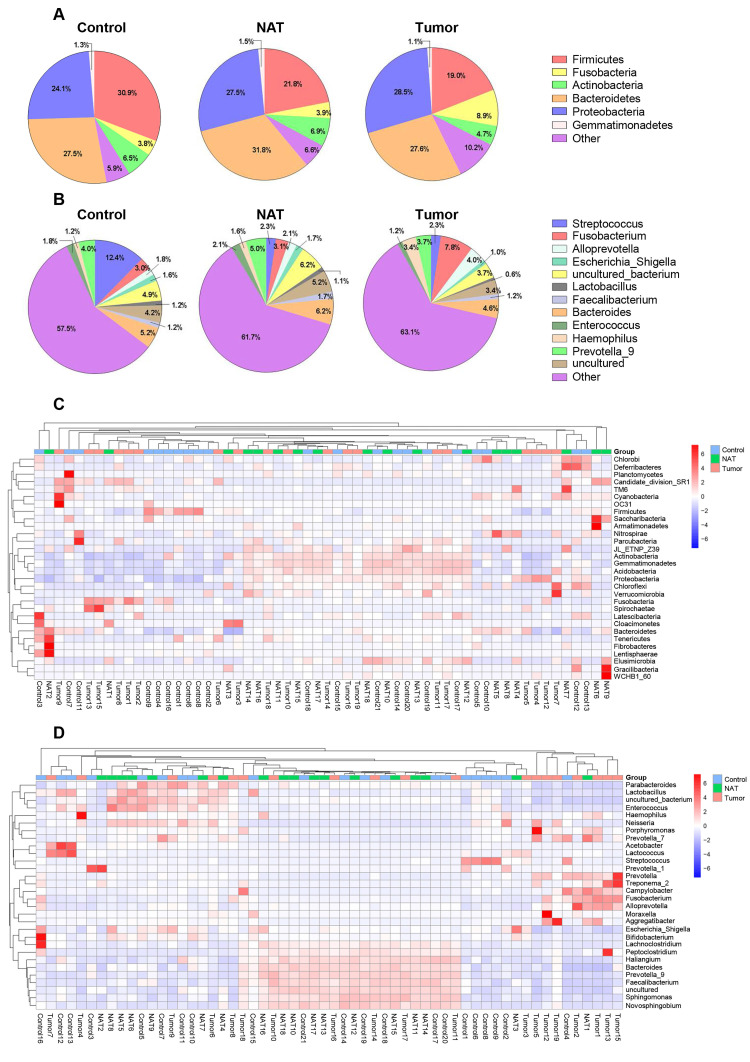
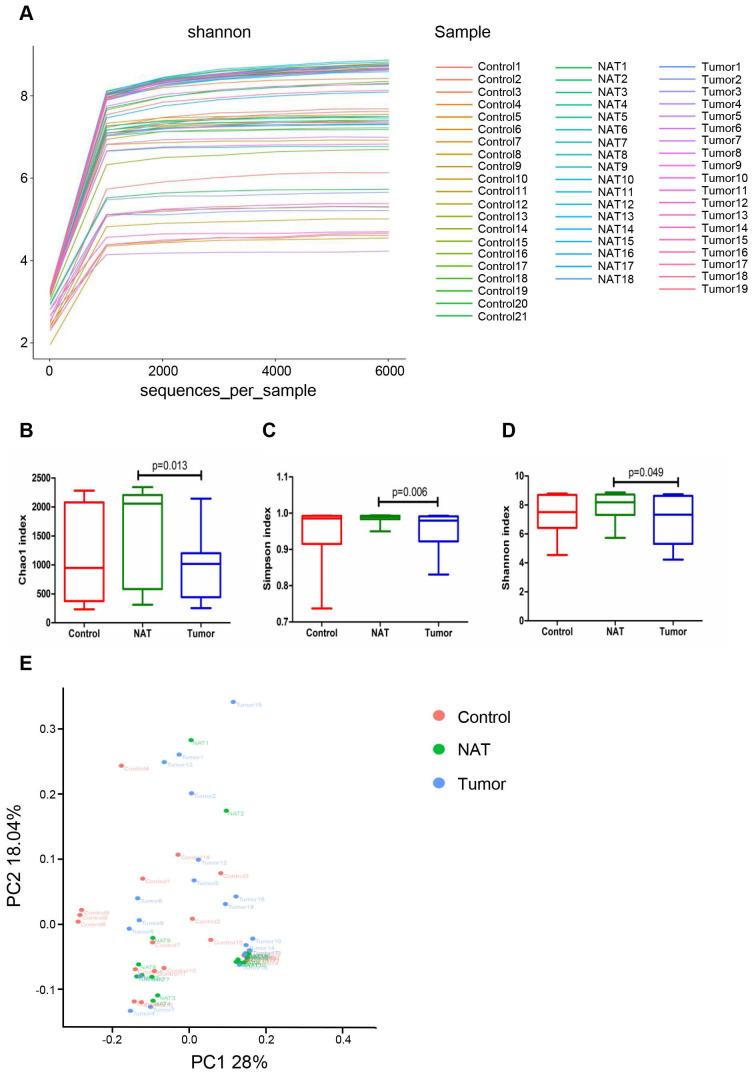
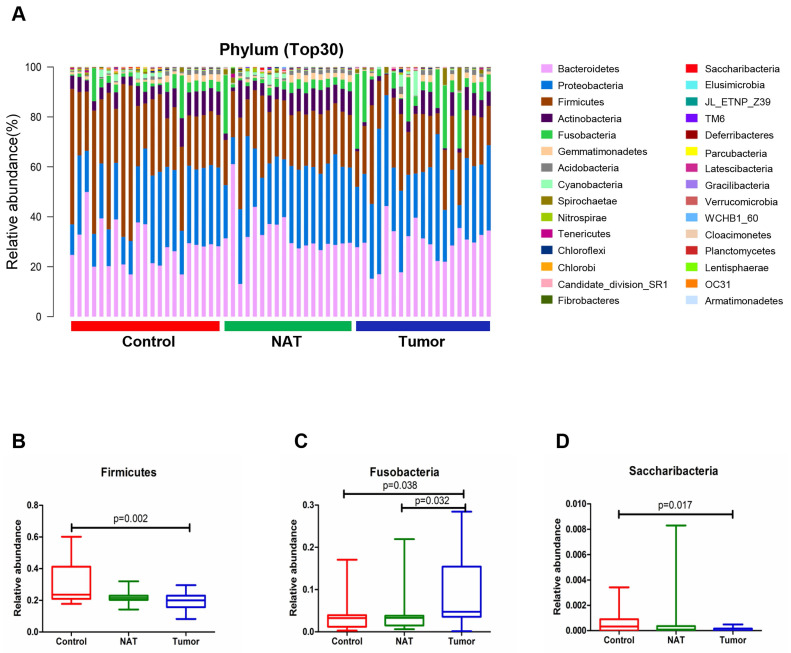
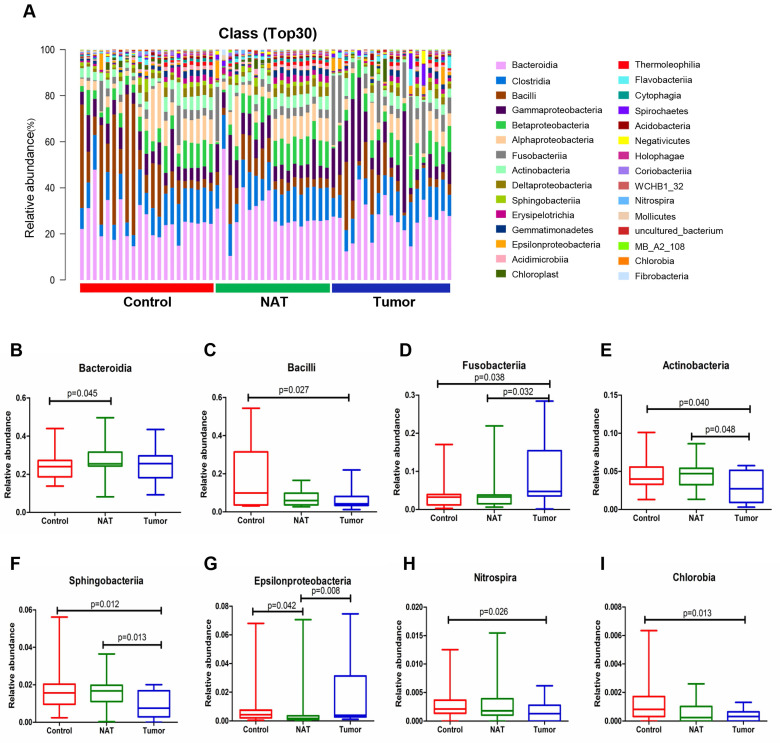
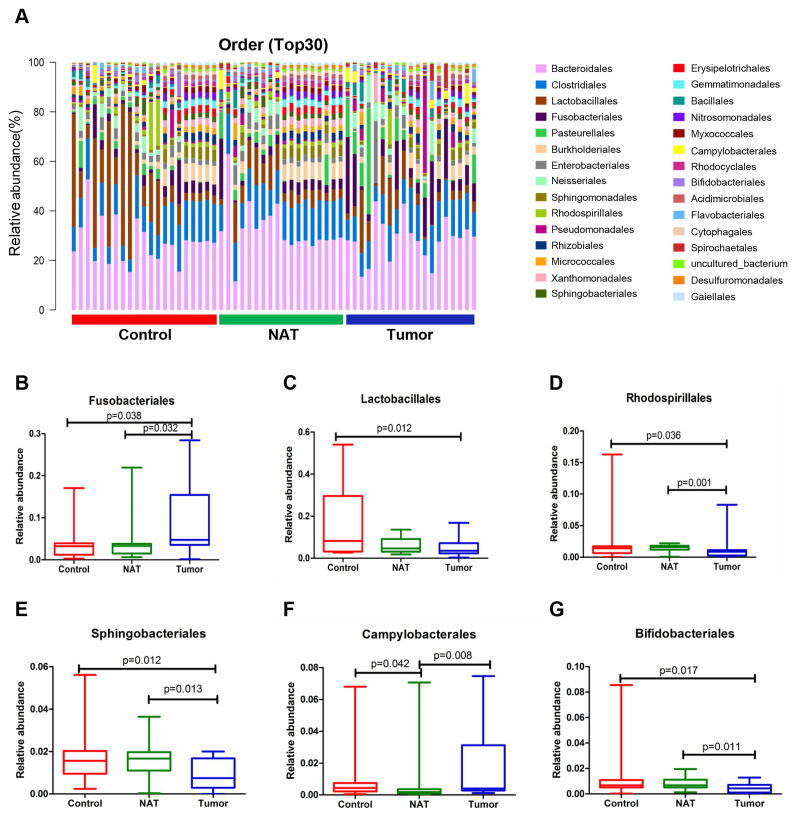
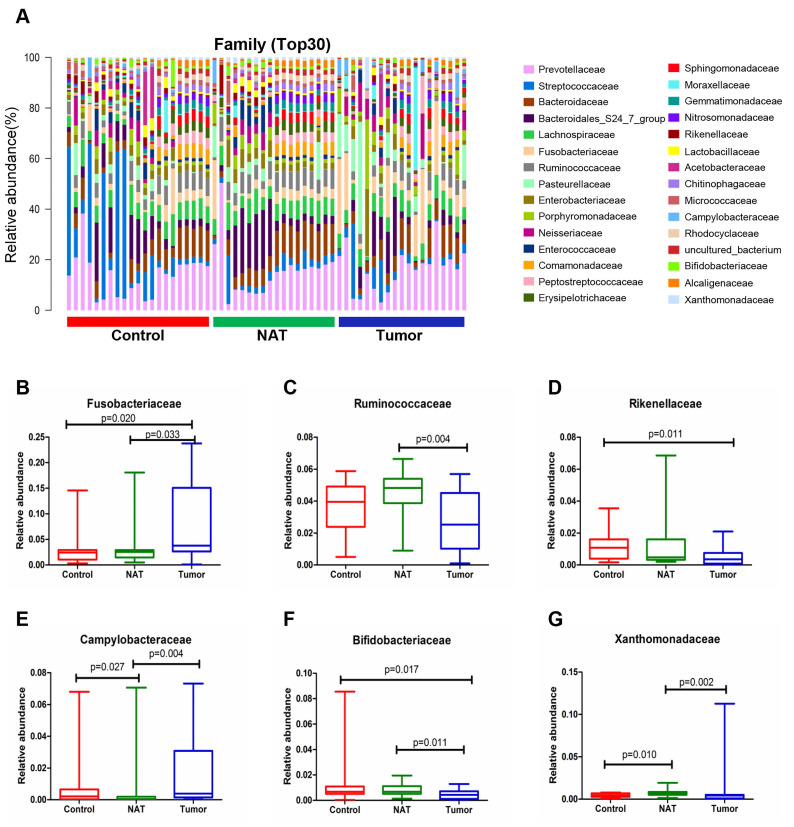
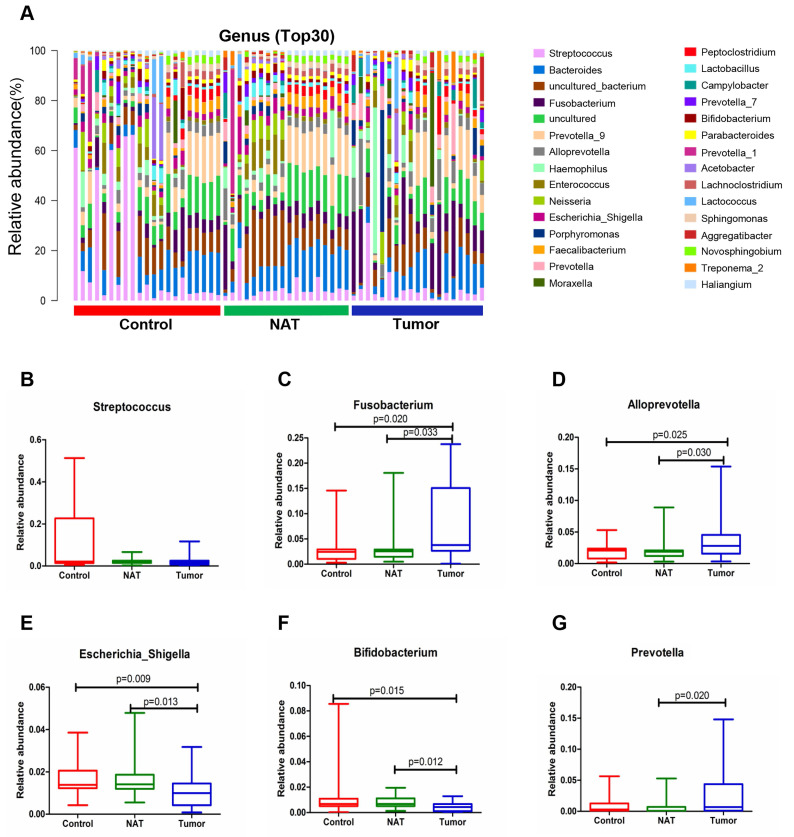
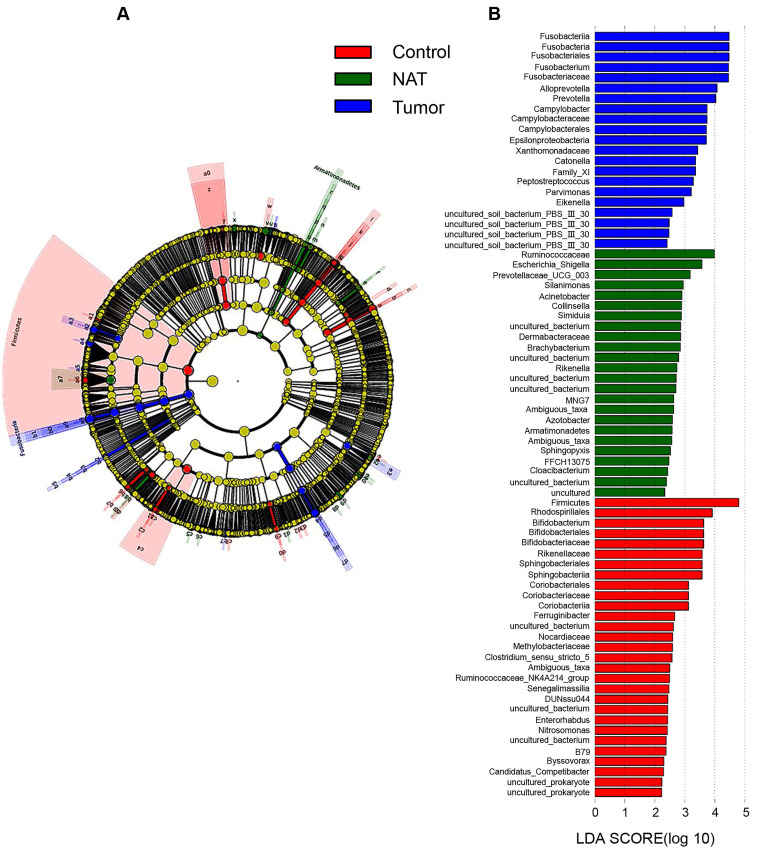
Bacteria are among the important factors that play a role in the balance of human health, and their relationship with some tumors has been well established. However, the association between bacteria colonizing the vocal cords and glottic laryngeal squamous cell carcinoma (GLSCC) remains unclear. Here, we investigated whether bacterial communities of the vocal cord mucous membrane play a role in the development of GLSCC. We collected tumor tissue and normal adjacent tissue (NAT) samples from 19 GLSCC patients, and the bacterial communities were compared with control samples (control) from 21 vocal cord polyps using 16S rRNA high-throughput pyrosequencing. We detected 41 phyla, 93 classes, 188 orders, 373 families, and 829 genera in the vocal cord mucous membrane. A comparison of the bacterial communities in the NAT samples showed higher α-diversity than in the tumor samples. In the tumor samples, seven groups of bacteria, i.e., the phylum Fusobacteria, the class Fusobacteriia, the order Fusobacteriales, the family Fusobacteriaceae, and the genera Fusobacterium, Alloprevotella, and Prevotella, were significantly enriched, as revealed by linear discriminant analysis coupled with effect size measurements (LEfSe). However, bacteria from the phylum Firmicutes were most significantly enriched in the vocal cord polyp tissues. These findings suggest alterations in the bacterial community structure of the vocal cord mucous membrane of GLSCC patients and that seven groups of bacteria are related to GLSCC, indicating that imbalances in bacterial communities increase the risk for the development of GLSCC.
Keywords: 16S rRNA sequences.; bacterial communities; glottic laryngeal squamous cell carcinoma; microbiota; vocal cord.
© The author(s).
Conflict of interest statement
Competing Interests: The authors have declared that no competing interest exists.
Figures
Similar articles
-
Composition and abundance of microbiota in the pharynx in patients with laryngeal carcinoma and vocal cord polyps.J Microbiol. 2017 Aug;55(8):648-654. doi: 10.1007/s12275-017-6636-8. Epub 2017 Jul 28. J Microbiol. 2017. PMID: 28752291
-
The Composition of Microbiome in Larynx and the Throat Biodiversity between Laryngeal Squamous Cell Carcinoma Patients and Control Population.PLoS One. 2013 Jun 18;8(6):e66476. doi: 10.1371/journal.pone.0066476. Print 2013. PLoS One. 2013. PMID: 23824228 Free PMC article.
-
Microbiota in the Throat and Risk Factors for Laryngeal Carcinoma.Appl Environ Microbiol. 2014 Dec;80(23):7356-63. doi: 10.1128/AEM.02329-14. Epub 2014 Sep 19. Appl Environ Microbiol. 2014. PMID: 25239901 Free PMC article.
-
Carcinoma of the larynx. Growth, p-classification and grading of squamous cell carcinoma of the vocal cords.Adv Otorhinolaryngol. 1984;32:1-123. Adv Otorhinolaryngol. 1984. PMID: 6369947 Review.
-
Radiotherapy with 6-megavolt photons for early glottic carcinoma: potential impact of extension to the posterior vocal cord.Am J Otolaryngol. 2001 Jan-Feb;22(1):43-54. doi: 10.1053/ajot.2001.20679. Am J Otolaryngol. 2001. PMID: 11172214 Review.
Cited by
-
Case report: isolated prevotella intermedia causing intracranial infection detected using metagenomic next generation sequencing.BMC Neurol. 2023 Oct 23;23(1):383. doi: 10.1186/s12883-023-03374-5. BMC Neurol. 2023. PMID: 37872501 Free PMC article.
-
[Progress in the relationship between head and neck squamous cell carcinom and the microbial community].Lin Chuang Er Bi Yan Hou Tou Jing Wai Ke Za Zhi. 2023 Jun;37(6):498-502. doi: 10.13201/j.issn.2096-7993.2023.06.019. Lin Chuang Er Bi Yan Hou Tou Jing Wai Ke Za Zhi. 2023. PMID: 37253529 Free PMC article. Chinese.
-
Prevotella species as oral residents and infectious agents with potential impact on systemic conditions.J Oral Microbiol. 2022 May 26;14(1):2079814. doi: 10.1080/20002297.2022.2079814. eCollection 2022. J Oral Microbiol. 2022. PMID: 36393976 Free PMC article. Review.
-
Cross-comparison of microbiota in the oropharynx, hypopharyngeal squamous cell carcinoma and their adjacent tissues through quantitative microbiome profiling.J Oral Microbiol. 2022 May 10;14(1):2073860. doi: 10.1080/20002297.2022.2073860. eCollection 2022. J Oral Microbiol. 2022. PMID: 35573640 Free PMC article.
-
Clinical Relevance and Drug Modulation of PPAR Signaling Pathway in Triple-Negative Breast Cancer: A Comprehensive Analysis.PPAR Res. 2024 Dec 21;2024:4164906. doi: 10.1155/ppar/4164906. eCollection 2024. PPAR Res. 2024. PMID: 39735727 Free PMC article.
References
-
- Nicholson JK, Holmes E, Wilson ID. Gut microorganisms, mammalian metabolism and personalized health care.Nat Rev Microbiol. 2005; 3(5): 431-438. - PubMed
-
- Warren JR, Marshall B. Unidentified curved bacilli in the stomach of patients with gastritis and peptic ulceration. Lancet. 1984;1(8390):1311–1315. - PubMed
-
- Seo SS, Oh HY, Lee JK. et al. Combined effect of diet and cervical microbiome on the risk of cervical intraepithelial neoplasia. Clin Nutr. 2016;35(6):1434–1441. - PubMed
LinkOut - more resources
Full Text Sources
