

Prognostic Role of the Ubiquitin Proteasome System in Clear Cell Renal Cell Carcinoma: A Bioinformatic Perspective
- PMID: 34093816
- PMCID: PMC8176417
- DOI: 10.7150/jca.53760
Prognostic Role of the Ubiquitin Proteasome System in Clear Cell Renal Cell Carcinoma: A Bioinformatic Perspective
Abstract
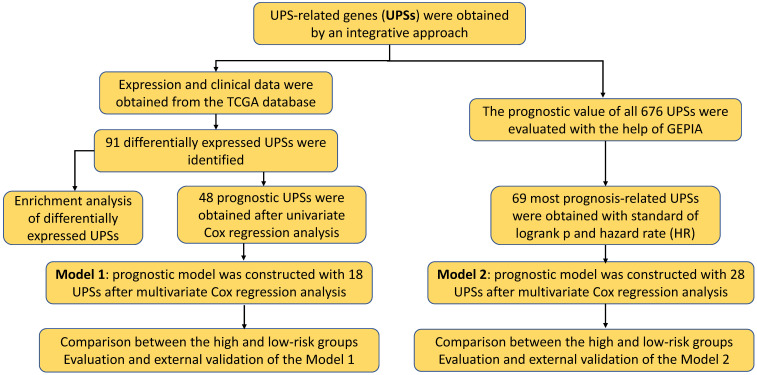
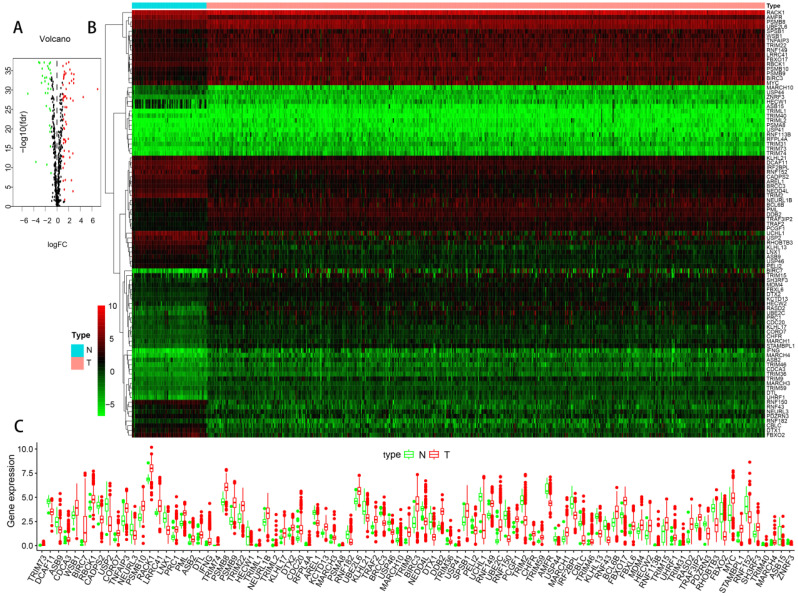
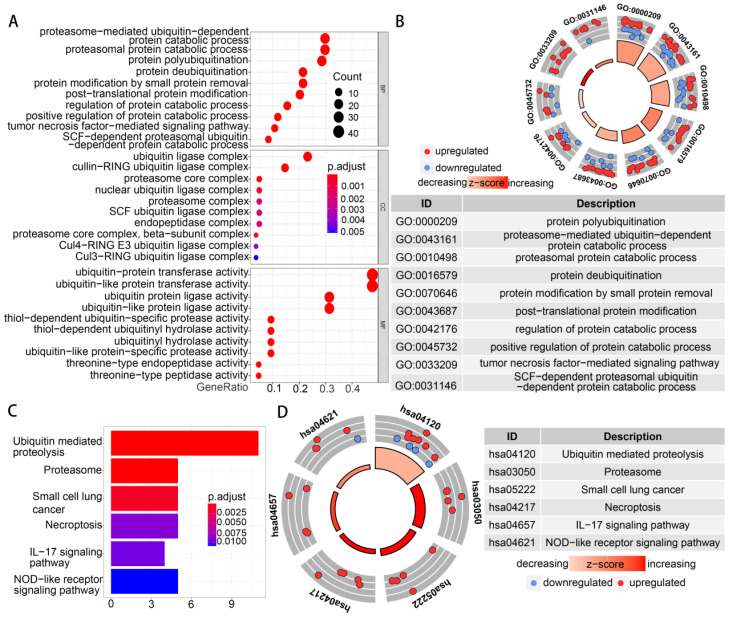
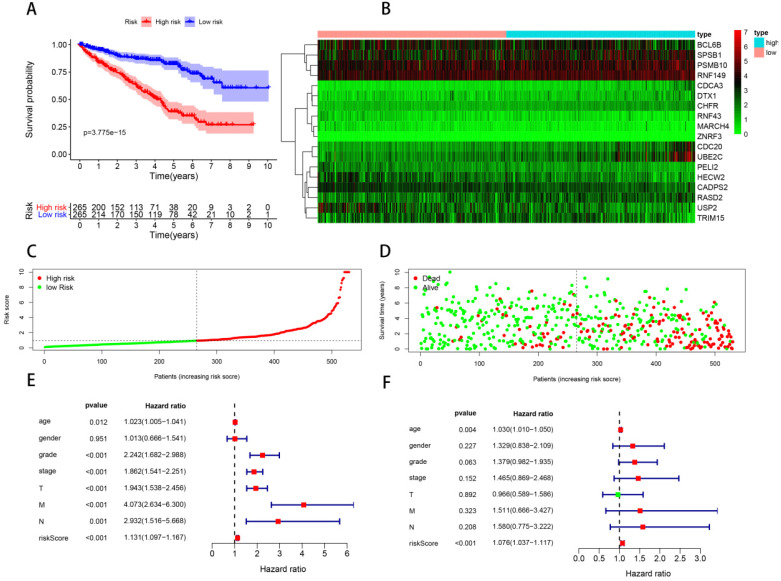
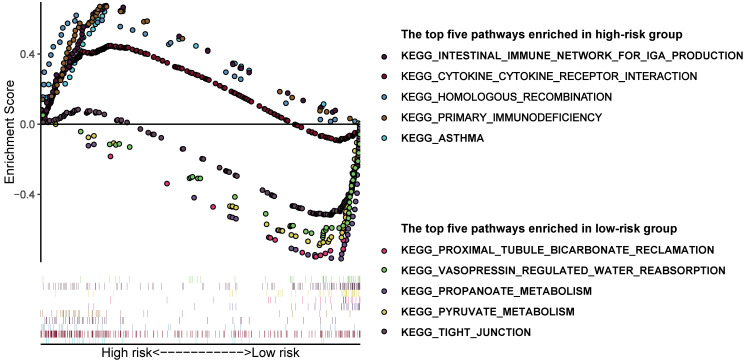
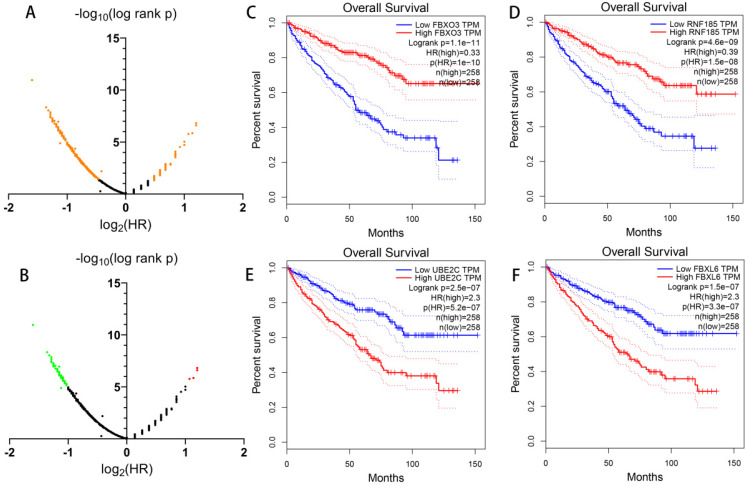
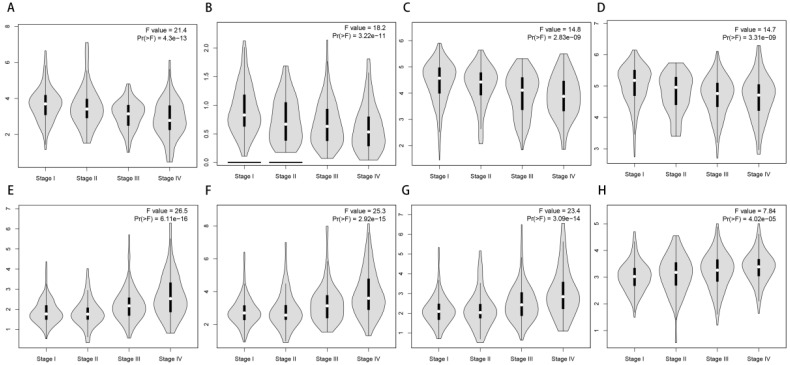
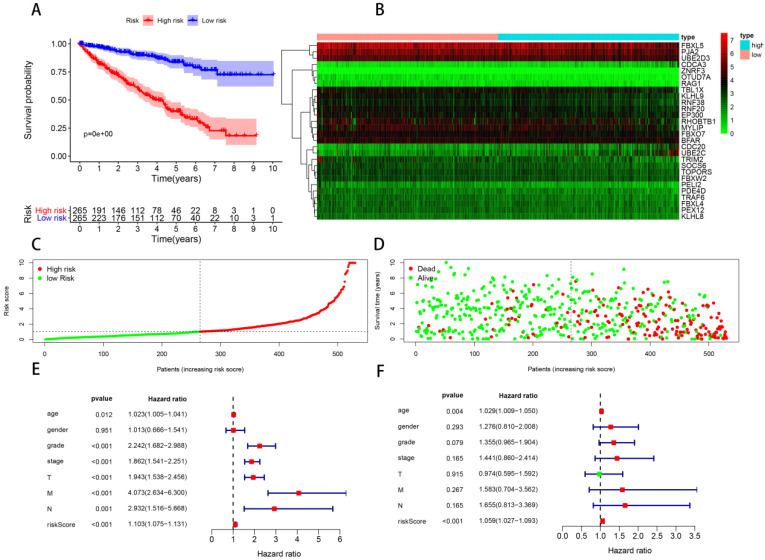
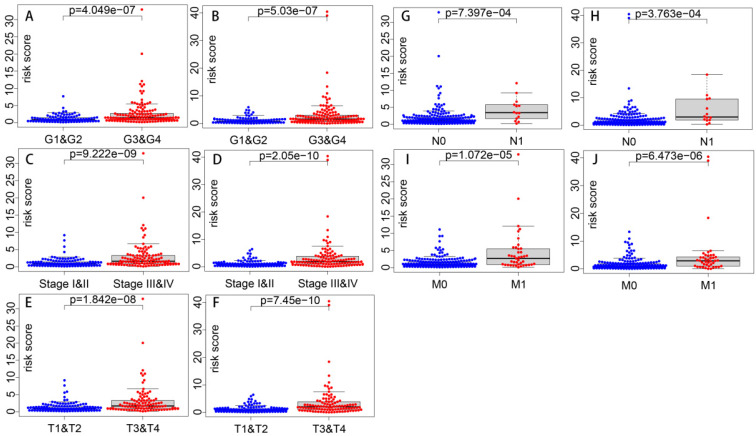
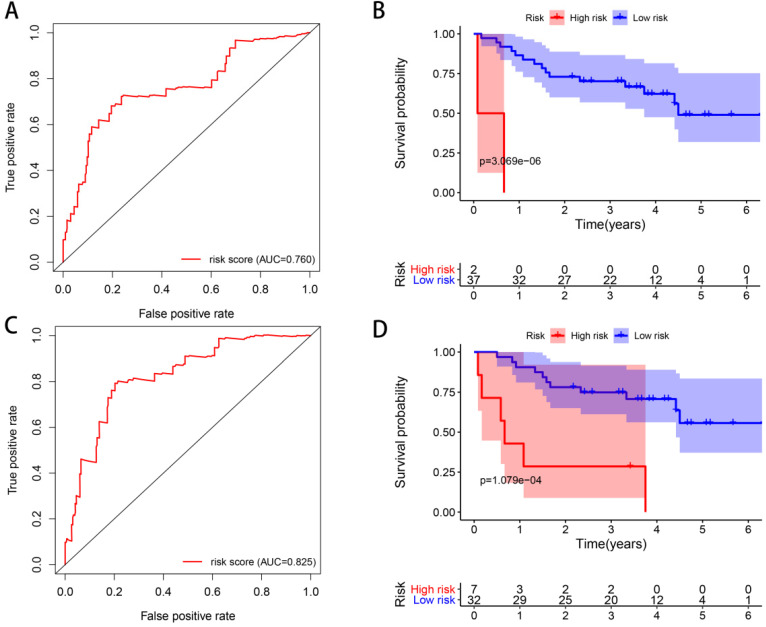
Background: Clear cell renal cell carcinoma (ccRCC) is a common malignant tumor of the urinary system. The ubiquitin proteasome system (UPS) plays an important role in the generation, metabolism and survival of tumor. We are aimed to make a comprehensive exploration of the UPS's role in ccRCC with bioinformatic tools, which may contribute to the understanding of UPS in ccRCC, and give insight for further research. Methods: The UPS-related genes (UPSs) were collected by an integrative approach. The expression and clinical data were downloaded from TCGA database. R soft was used to perform the differentially expressed UPSs analysis, functional enrichment analysis. We also estimated prognostic value of each UPS with the help of GEPIA database. Two predicting models were constructed with the differentially expressed UPSs and prognosis-related genes, respectively. The correlations of risk score with clinical characteristics were also evaluated. Data of GSE29609 cohort were obtained from GEO database to validate the prognostic models. Results: We finally identified 91 differentially expressed UPSs, 48 prognosis related genes among them, and constructed a prognostic model with 18 UPSs successfully, the AUC was 0.760. With the help of GEPIA, we found 391 prognosis-related UPSs, accounting for 57.84% of all UPSs. Another prognostic model was constructed with 28 prognosis-related genes of them, and with a better AUC of 0.825. Additionally, our models can also stratify patients into high and low risk groups accurately in GSE29609 cohort. Similar prognostic values of our models were observed in the validated GSE29609 cohort. Conclusions: UPS is dysregulated in ccRCC. UPS related genes have significant prognostic value in ccRCC. Models constructed with UPSs are effective and applicable. An abnormal ubiquitin proteasome system should play an important role in ccRCC and be worthy of further study.
Keywords: bioinformatics; clear cell renal cell carcinoma (ccRCC); prognosis; the ubiquitin proteasome system (UPS).
© The author(s).
Conflict of interest statement
Competing Interests: The authors have declared that no competing interest exists.
Figures
Similar articles
-
Development and validation of a prognostic immune-associated gene signature in clear cell renal cell carcinoma.Int Immunopharmacol. 2020 Apr;81:106274. doi: 10.1016/j.intimp.2020.106274. Epub 2020 Feb 7. Int Immunopharmacol. 2020. PMID: 32044664
-
The Landscape of Iron Metabolism-Related and Methylated Genes in the Prognosis Prediction of Clear Cell Renal Cell Carcinoma.Front Oncol. 2020 May 22;10:788. doi: 10.3389/fonc.2020.00788. eCollection 2020. Front Oncol. 2020. PMID: 32528886 Free PMC article.
-
Identification of a Novel Immune-Related Prognostic Biomarker and Small-Molecule Drugs in Clear Cell Renal Cell Carcinoma (ccRCC) by a Merged Microarray-Acquired Dataset and TCGA Database.Front Genet. 2020 Aug 18;11:810. doi: 10.3389/fgene.2020.00810. eCollection 2020. Front Genet. 2020. PMID: 33014010 Free PMC article.
-
Identification and validation of novel prognostic markers in Renal Cell Carcinoma.Dan Med J. 2017 Oct;64(10):B5339. Dan Med J. 2017. PMID: 28975890
-
Exploration on the Mechanism of Ubiquitin Proteasome System in Cerebral Stroke.Front Aging Neurosci. 2022 Apr 7;14:814463. doi: 10.3389/fnagi.2022.814463. eCollection 2022. Front Aging Neurosci. 2022. PMID: 35462700 Free PMC article. Review.
Cited by
-
Bortezomib advanced mechanisms of action in multiple myeloma, solid and liquid tumors along with its novel therapeutic applications.EXCLI J. 2023 Jan 16;22:146-168. doi: 10.17179/excli2022-5653. eCollection 2023. EXCLI J. 2023. PMID: 36998701 Free PMC article. Review.
-
Construction and experimental verification of a novel nine-glycosylation-related gene prognostic risk model for clear cell renal carcinoma.Heliyon. 2024 Oct 11;10(21):e39258. doi: 10.1016/j.heliyon.2024.e39258. eCollection 2024 Nov 15. Heliyon. 2024. PMID: 39524749 Free PMC article.
-
Amino Acid-Starved Cancer Cells Utilize Macropinocytosis and Ubiquitin-Proteasome System for Nutrient Acquisition.Adv Sci (Weinh). 2024 Jan;11(1):e2304791. doi: 10.1002/advs.202304791. Epub 2023 Nov 20. Adv Sci (Weinh). 2024. PMID: 37983609 Free PMC article.
-
Development and validation of a ubiquitin-proteasome system gene signature for prognostic prediction and immune microenvironment evaluation in hepatocellular carcinoma.J Cancer Res Clin Oncol. 2023 Nov;149(14):13363-13382. doi: 10.1007/s00432-023-05189-w. Epub 2023 Jul 25. J Cancer Res Clin Oncol. 2023. PMID: 37490101 Free PMC article.
References
-
- Siegel RL, Miller KD, Jemal A. Cancer statistics, 2019. CA Cancer J Clin. 2019;69:7–34. - PubMed
-
- Lopez-Beltran A, Carrasco JC, Cheng L, Scarpelli M, Kirkali Z, Montironi R. 2009 update on the classification of renal epithelial tumors in adults. Int J Urol. 2009;16:432–43. - PubMed
-
- Athar U, Gentile TC. Treatment options for metastatic renal cell carcinoma: a review. Can J Urol. 2008;15:3954–66. - PubMed
-
- Rossi SH, Blick C, Handforth C, Brown JE, Stewart GD, Renal Cancer Gap Analysis C. Essential Research Priorities in Renal Cancer: A Modified Delphi Consensus Statement. Eur Urol Focus. 2020;6:991–8. - PubMed
LinkOut - more resources
Full Text Sources
