. 2021 May 8;11(14):6891-6904.
doi: 10.7150/thno.53170. eCollection 2021.

Tanshinone I, a new EZH2 inhibitor restricts normal and malignant hematopoiesis through upregulation of MMP9 and ABCG2

Affiliations

Tanshinone I, a new EZH2 inhibitor restricts normal and malignant hematopoiesis through upregulation of MMP9 and ABCG2

Ying Huang et al. Theranostics. .

Abstract

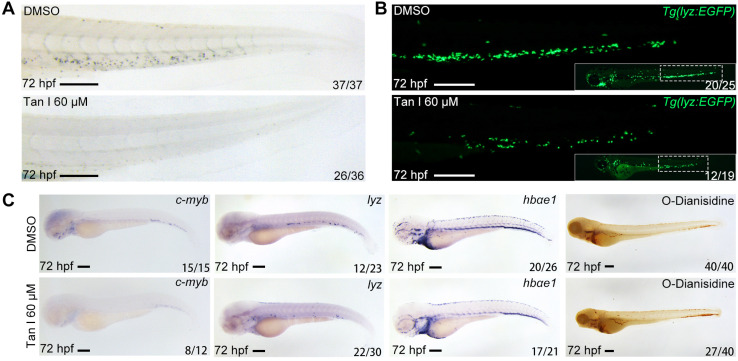
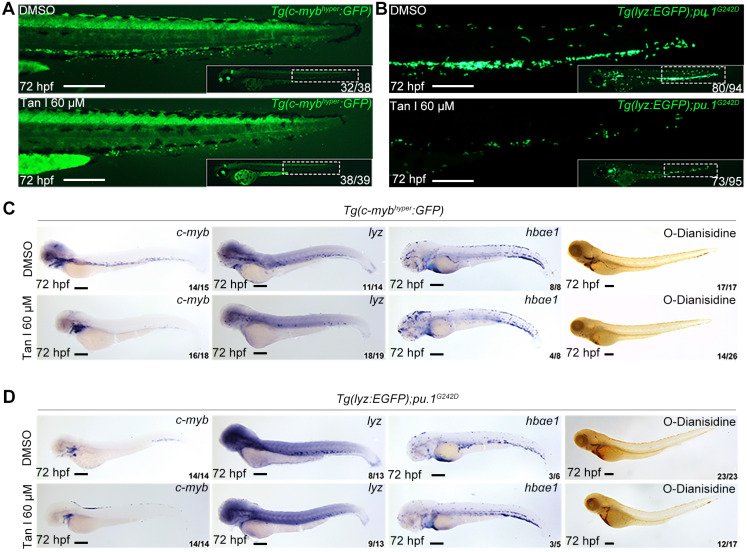
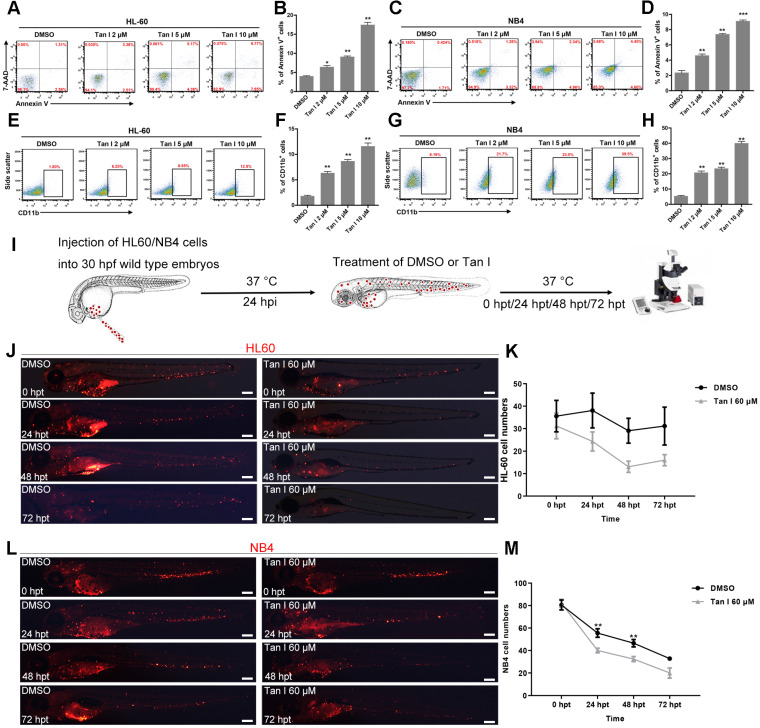
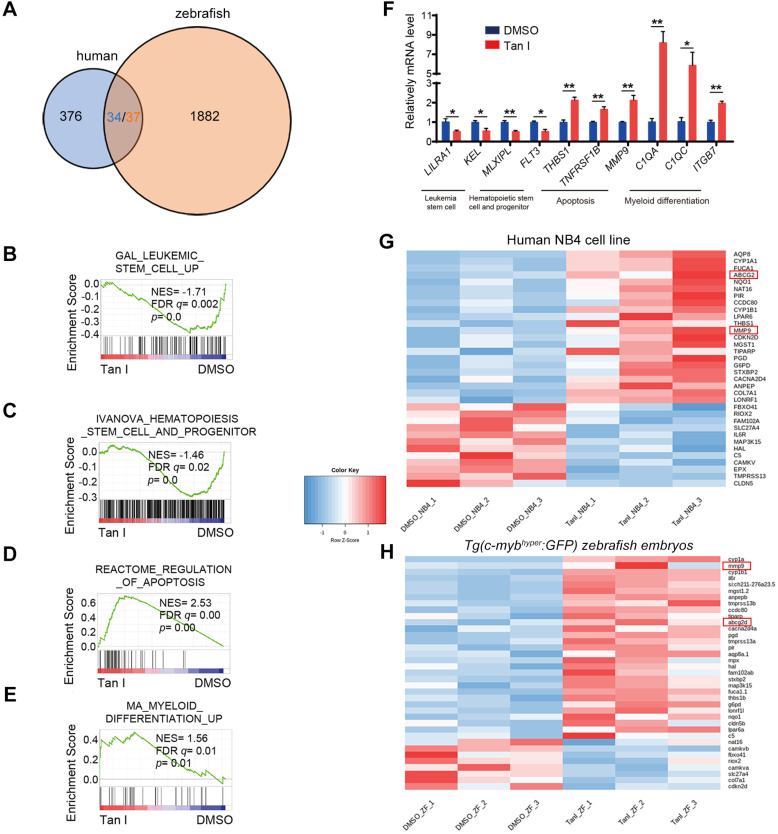
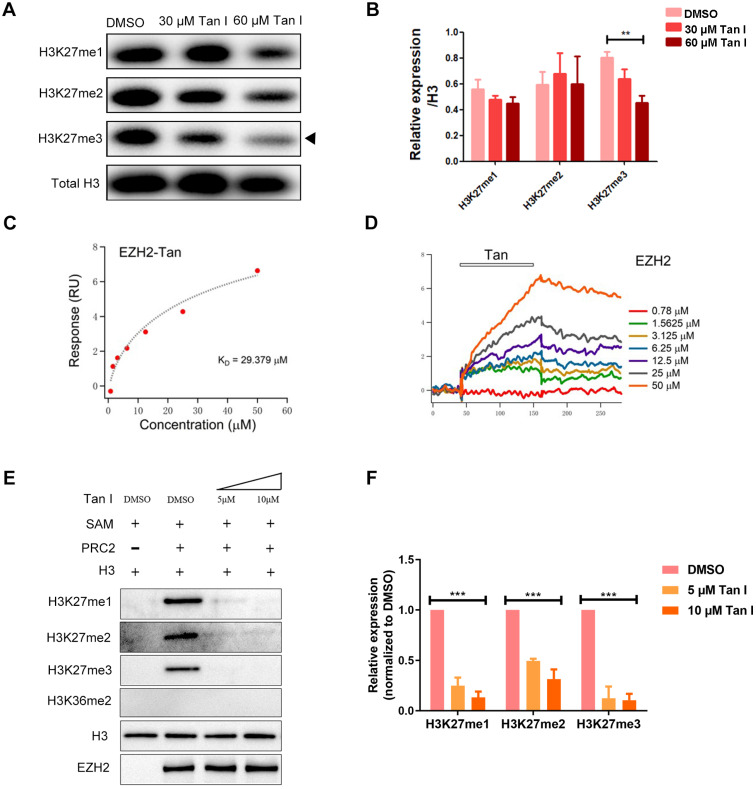
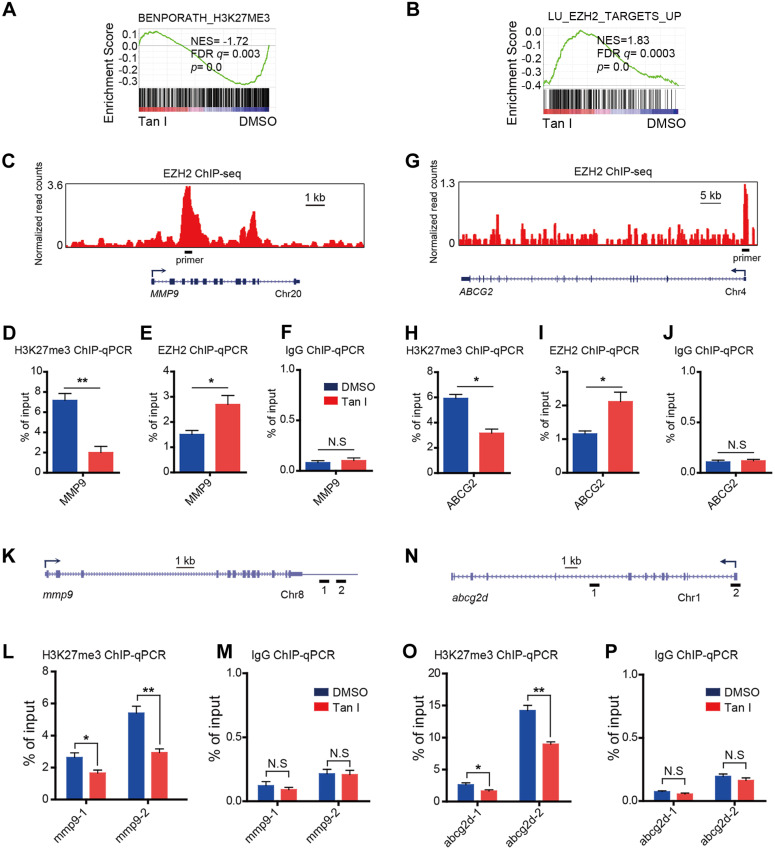
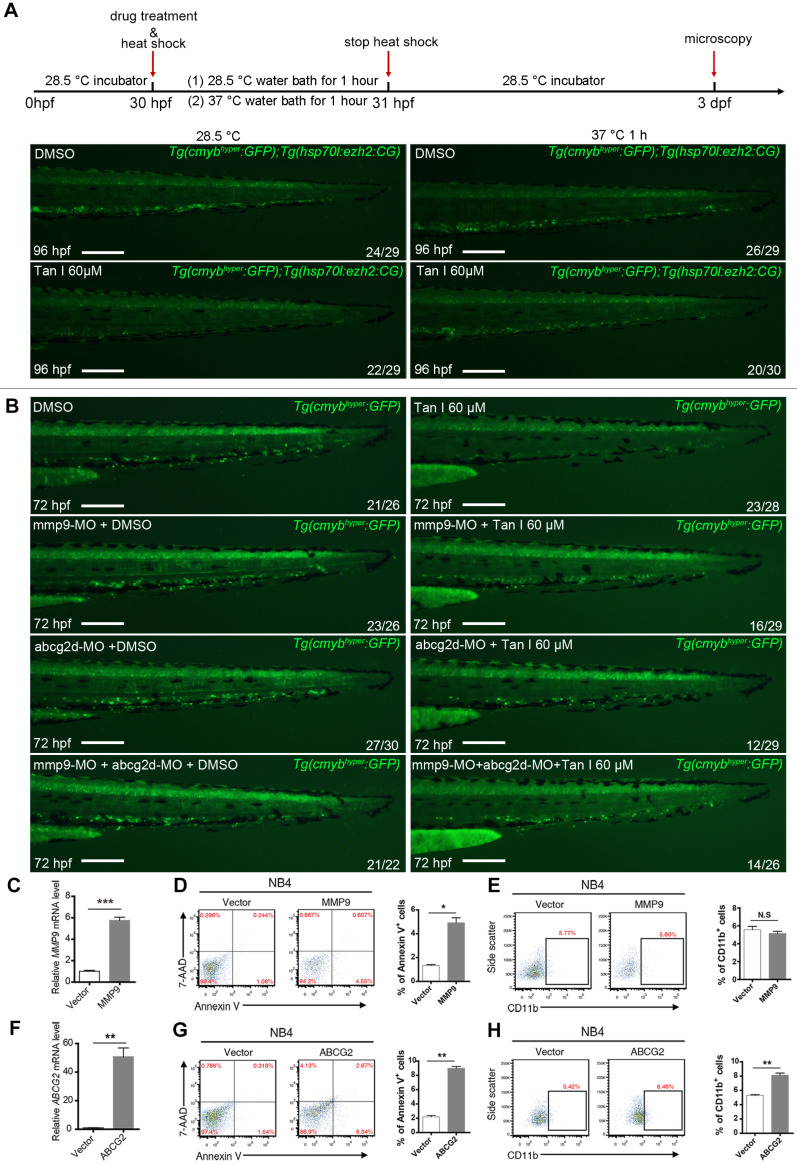
Rationale: Tanshinone, a type of diterpenes derived from salvia miltiorrhiza, is a particularly promising herbal medicine compound for the treatment of cancers including acute myeloid leukemia (AML). However, the therapeutic function and the underlying mechanism of Tanshinone in AML are not clear, and the toxic effect of Tanshinone limits its clinical application. Methods: Our work utilizes human leukemia cell lines, zebrafish transgenics and xenograft models to study the cellular and molecular mechanisms of how Tanshinone affects normal and abnormal hematopoiesis. WISH, Sudan Black and O-Dianisidine Staining were used to determine the expression of hematopoietic genes on zebrafish embryos. RNA-seq analysis showed that differential expression genes and enrichment gene signature with Tan I treatment. The surface plasmon resonance (SPR) method was used with a BIAcore T200 (GE Healthcare) to measure the binding affinities of Tan I. In vitro methyltransferase assay was performed to verify Tan I inhibits the histone enzymatic activity of the PRC2 complex. ChIP-qPCR assay was used to determine the H3K27me3 level of EZH2 target genes. Results: We found that Tanshinone I (Tan I), one of the Tanshinones, can inhibit the proliferation of human leukemia cells in vitro and in the xenograft zebrafish model, as well as the normal and malignant definitive hematopoiesis in zebrafish. Mechanistic studies illustrate that Tan I regulates normal and malignant hematopoiesis through direct binding to EZH2, a well-known histone H3K27 methyltransferase, and inhibiting PRC2 enzymatic activity. Furthermore, we identified MMP9 and ABCG2 as two possible downstream genes of Tan I's effects on EZH2. Conclusions: Together, this study confirmed that Tan I is a novel EZH2 inhibitor and suggested MMP9 and ABCG2 as two potential therapeutic targets for myeloid malignant diseases.

Keywords: EZH2; H3K27me3; Tanshinone I; hematopoiesis; leukemia.


Conflict of interest statement

Competing Interests: The authors have declared that no competing interest exists.

Figures

Figure 1
Figure 1
Tan I treatment leads to a decrease of definitive hematopoiesis in zebrafish. (A) Sudan Black staining of Caudal hematopoietic tissue (CHT) regions of the DMSO or Tan I treated embryos at 72 hpf. (B) Fluorescent images of CHT regions (the framed region of whole embryos in the right bottom) of the Tg(lyz:EGFP) zebrafish embryos at 72 hpf treated with DMSO or Tan I. (C) Images of the embryos treated with DMSO or Tan I WISH analyzed with c-myb, lyz, hbαe1 probes or stained with O-Dianisidine. Scale bars: 200 µm.
Figure 2
Figure 2
Tan I treatment can inhibit the expanded myelopoiesis in c-myb hyperactive and pu.1G242D zebrafish. (A) Fluorescent images of Tg(c-mybhyper:GFP) zebrafish embryos with DMSO or Tan I treatments. (B) Fluorescent images of Tg(lyz:EGFP);pu.1G242D zebrafish embryos treated with DMSO or Tan I. (C) Images of Tg(c-mybhyper:GFP) embryos treated with DMSO or Tan I by -c-myb, lyz, and hbαe1 WISH and O-dianisidine staining. (D) Images of Tg(lyz:EGFP);pu.1G242D embryos treated with DMSO or Tan I evaluated by c-myb, lyz, and hbαe1 WISH or O-dianisidine staining. All treatments were continuously starting from 30 hpf. Embryos in all images were at 72 hpf of development. Scale bars: 200 µm.
Figure 3
Figure 3
Tan I inhibits the proliferation of human leukemia cell lines in vitro and in the zebrafish xenograft model. (A-D) Flow cytometric analyses of Annexin V and 7-AAD staining after treatments of HL-60 (A, B) or NB4 (C, D) cells with DMSO or the indicated concentrations of Tan I for 3 days. (E-H) Flow cytometric analyses of CD11b expression after treatments of HL-60 (E, F) or NB4 (G, H) cells with DMSO or the indicated concentrations of Tan I for 3 days. (I) Cartoon illustrating steps of the embryonic zebrafish xenograft assay, hpi (hours post-injection), hpt (hours post-treatment). (J) Fluorescent images of HL-60-cell grafted zebrafish embryos at indicated times post transplantation with DMSO or Tan I treatments. (K) Statistic analysis of HL-60 cell number in the CHT regions of images in panel J, Error bars represent standard error of means (SEM). (L) Fluorescent images of NB4-cell grafted zebrafish embryos at indicated times post transplantation with DMSO or Tan I treatments. (M) Statistic analysis of NB4 cell number in the CHT regions of embryos shown in panel L, Error bars represent standard error of means (SEM). Scale bars: 200 µm.\
Figure 4
Figure 4
Transcriptomic analysis of Tan I-treated human leukemia cell line and zebrafish. (A) Venn diagram showing the numbers of differentially expressed genes between DMSO and Tan I treated NB4 cell (blue) or Tg(c-mybhyper:GFP) zebrafish (orange), the overlapped gene number also shown (three of the human genes have two homologs each in zebrafish). (B-E) GSEA (Gene Set Enrichment Analysis) of the expressing profile of NB4 cells treated with DMSO or Tan I using a leukemia stem cell-associated upregulated signature (B), a hematopoietic stem cell and progenitor-associated signature (C), an apoptosis-associated signature (D) and a myeloid differentiation-associated upregulated signature (E). (F) RT-qPCR assay on the mRNA levels of a number of genes after treatments of NB4 cells with DMSO or 10 µM Tan I for 3 days. (G-H) Heatmap of 36 differentially expressed genes between DMSO and Tan I treatment in both human NB4 cell (G) and Tg(c-mybhyper:GFP) zebrafish (H).
Figure 5
Figure 5
Tan I binds to EZH2 directly and inhibit PCR2 enzyme activity. (A-B) c-mybhyper zebrafish embryos were treated with DMSO or indicated concentrations of Tan I. The histone H3K27me1, me2, me3 levels were measured by western blotting, total histone H3 was used as the control. (B) is the quantification of the western blotting. (C-D) SPR analysis of the binding between EZH2 and Tan I at different concentrations. The open bar in (D) indicated the duration of Tan I perfusion in SPR. (E-F) In vitro inhibition of PRC2 complex activities by Tan I. In detail, the indicated proteins (0.28 μg of the PRC2 complex and 0.2 µg of histone H3) were mixed with Tan I and SAM. The reaction products were separated by 15% SDS-PAGE and analyzed by western blotting using antibodies against histone H3K27me1, me2, me3, H3K36me2, histone H3, and EZH2.
Figure 6
Figure 6
Tan I affects the H3K27me3 modifications at the regulatory regions of the EZH2 downstream genes. (A-B) GSEA of the expression profile of NB4 cells treated with DMSO or Tan I using a histone H3K27me3-associated signature “BENPORATH_H3K27ME3” (A) and an EZH2 target genes-associated signature “LU_EZH2_TARGETS_UP (M2139)” (B). (C) Genome browser track representing the binding sites of EZH2 at MMP9 gene locus in human LNCaP cells. (D-F) ChIP-qPCR assay of H3K27me3 (D), EZH2 (E) or IgG (F) occupancy at MMP9 gene locus in NB4 cells treated with DMSO or 10 µM Tan I for 3 days. (G) Genome browser track representing the binding sites of EZH2 at ABCG2 gene locus in human LNCaP cells. (H-J) ChIP-qPCR assay of H3K27me3 (H), EZH2 (I) or IgG (J) occupancy at the ABCG2 gene locus in NB4 cells treated with DMSO or 10 µM Tan I for 3 days. (K) Horizontal lines with Arabic numeral 1 to 2 indicate the regions at the mmp9 gene locus amplified by qPCR in zebrafish ChIP assay. (L-M) ChIP-qPCR assay for H3K27me3 (L) or IgG (M) occupancy at the mmp9 gene locus in zebrafish embryos treated with DMSO or 60 µM Tan I for 3 days. (N) Horizontal lines with Arabic numeral 1 to 2 indicate the regions at the abcg2d gene locus amplified by qPCR in zebrafish ChIP assay. (O-P) ChIP-qPCR assay for H3K27me3 (O) or IgG (P) occupancy at the abcg2d gene locus in zebrafish embryos treated with DMSO or 60 µM Tan I for 3 days. Data are presented as the mean ± SEM. *p < 0.05, **p < 0.01. All results are from three independent experiments.
Figure 7
Figure 7
Rescue experiment in zebrafish and overexpression experiment in the human leukemia cell line by ezh2 or its downstream genes mmp9 or abcg2. (A) Rescue Tan I induced phenotype by overexpression of ezh2 in the zebrafish embryo. Fluorescent images of c-myb GFP+ cells in Tg(c-mybhyper:GFP) and Tg(hsp70l:ezh2:CG) double transgenic zebrafish embryos, with DMSO or Tan I treatments and with or without a 37 ºC heat shock for 1h, as indicated. dpf (days post-fertilization) (B) Rescue Tan I induced phenotype by knockdown of mmp9 and abcg2 in the zebrafish embryo. Fluorescent images of c-myb GFP+ cells in Tg(c-mybhyper:GFP) transgenic zebrafish embryos. As indicated, mmp9 and abcg2d morpholino was injected separately or together in DMSO or Tan I treated embryos. (C-E) Overexpression MMP9 in NB4 cells. RT-qPCR analyses of MMP9 mRNA level on the established NB4 cells transduced with an empty vector or MMP9-expressing vector (C). Flow cytometric analyses of Annexin V/7-AAD staining (D) and CD11b expression (E) in control or MMP9-overexpressed NB4 cells; (F-H) Overexpression of ABCG2 in NB4 cells. RT-qPCR analyses of ABCG2 mRNA level on the established NB4 cells transduced with empty vector or ABCG2-expressing vector (F). Flow cytometric analyses of Annexin V/7-AAD staining (G) and CD11b expression (H) in control or ABCG2-overexpressed NB4 cells. Scale bars: 200 µm.

References

    1. Arrowsmith CH, Bountra C, Fish PV, Lee K, Schapira M. Epigenetic protein families: a new frontier for drug discovery. Nat Rev Drug Discov. 2012;11(5):384–400. - PubMed
    1. Cao R, Wang L, Wang H, Xia L, Hediye EB, Paul T. et al. Role of histone H3 lysine 27 methylation in polycomb-group silencing. Science. 2002;298(5595):1039–43. - PubMed
    1. Kim KH, Roberts CW. Targeting EZH2 in cancer. Nat Med. 2016;22(2):128–34. - PMC - PubMed
    1. Mochizuki-Kashio M, Mishima Y, Miyagi S, Negishi M, Saraya A, Konuma T. et al. Dependency on the polycomb gene Ezh2 distinguishes fetal from adult hematopoietic stem cells. Blood. 2011;118(25):6553–61. - PubMed
    1. Jiang Y, Xiang C, Zhong F, Zhang Y, Wang L, Zhao Y. et al. Histone H3K27 methyltransferase EZH2 and demethylase JMJD3 regulate hepatic stellate cells activation and liver fibrosis. Theranostics. 2021;11(1):361–78. - PMC - PubMed

Publication types

MeSH terms