. 2021 May 8;11(14):6950-6965.
doi: 10.7150/thno.58956. eCollection 2021.

Serotonin/HTR1E signaling blocks chronic stress-promoted progression of ovarian cancer

Affiliations

Serotonin/HTR1E signaling blocks chronic stress-promoted progression of ovarian cancer

Xuan Qin et al. Theranostics. .

Abstract

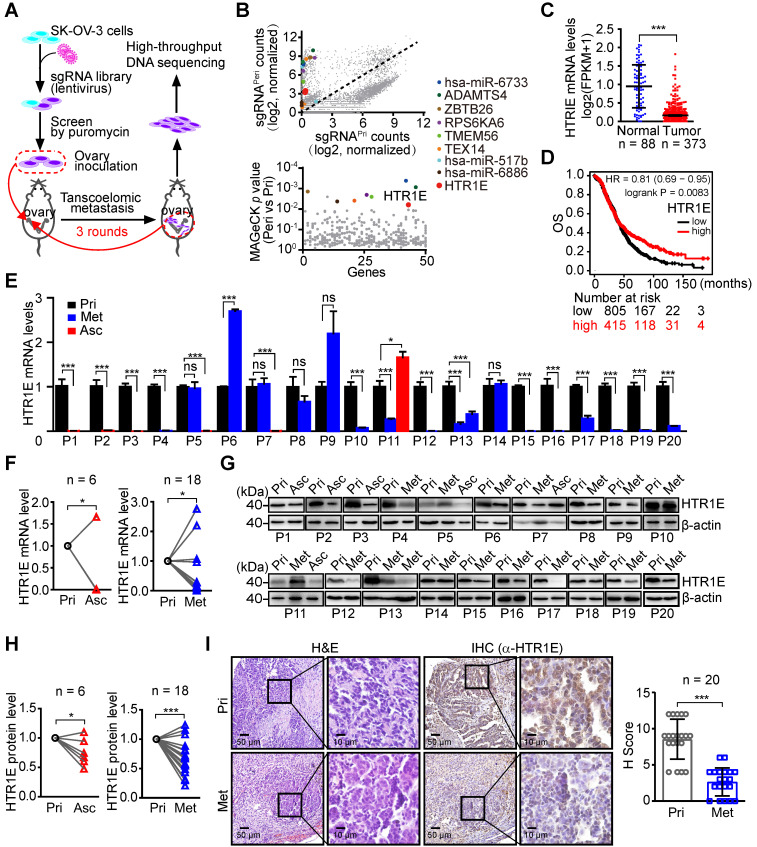
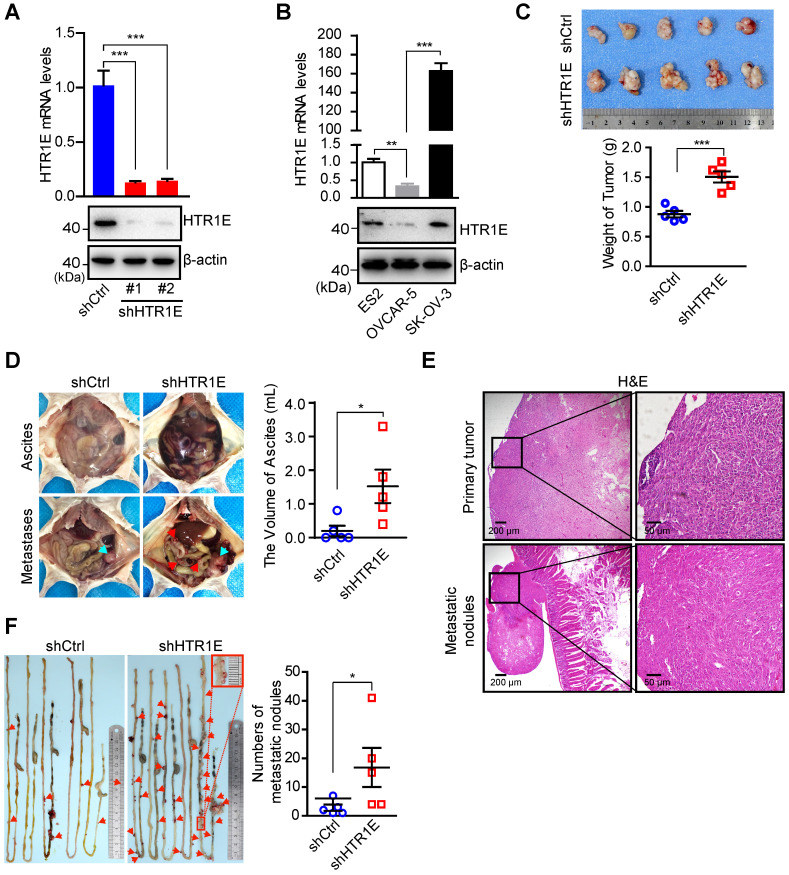
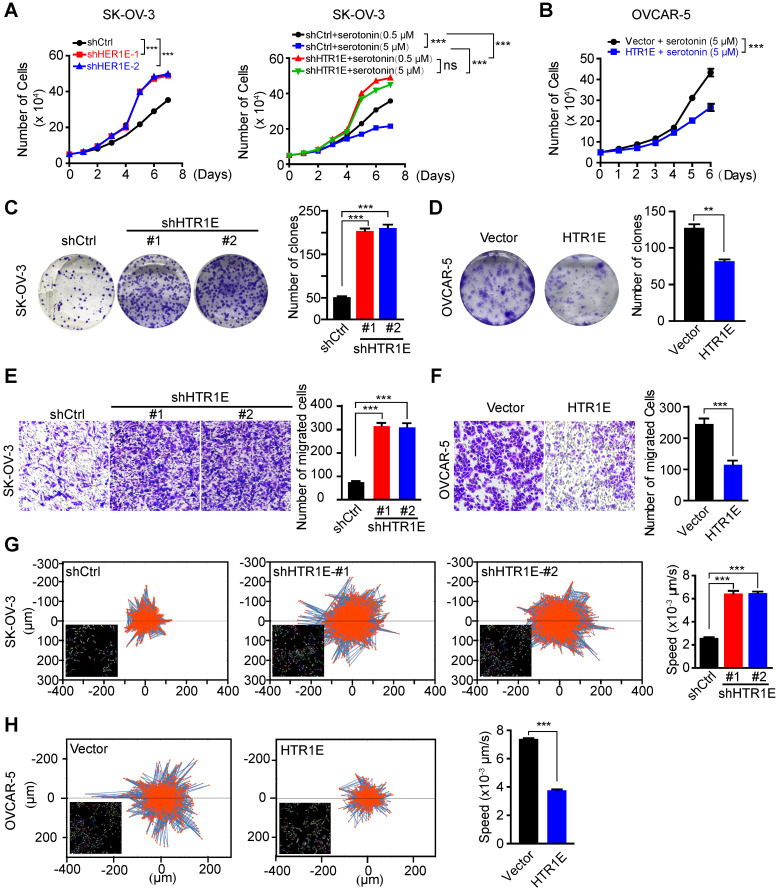
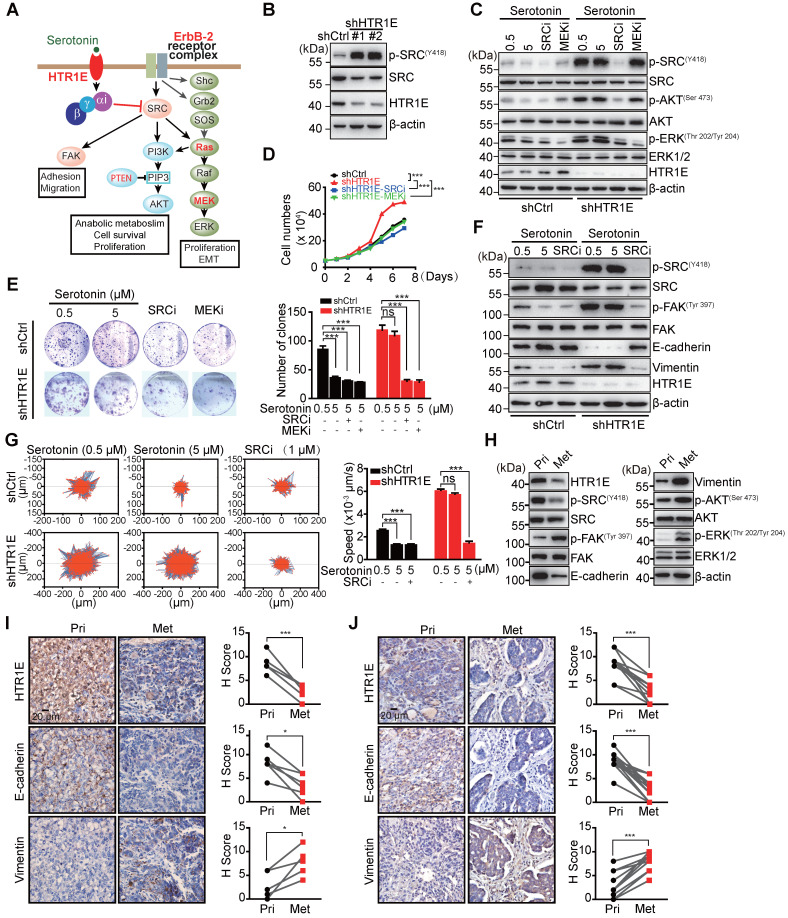
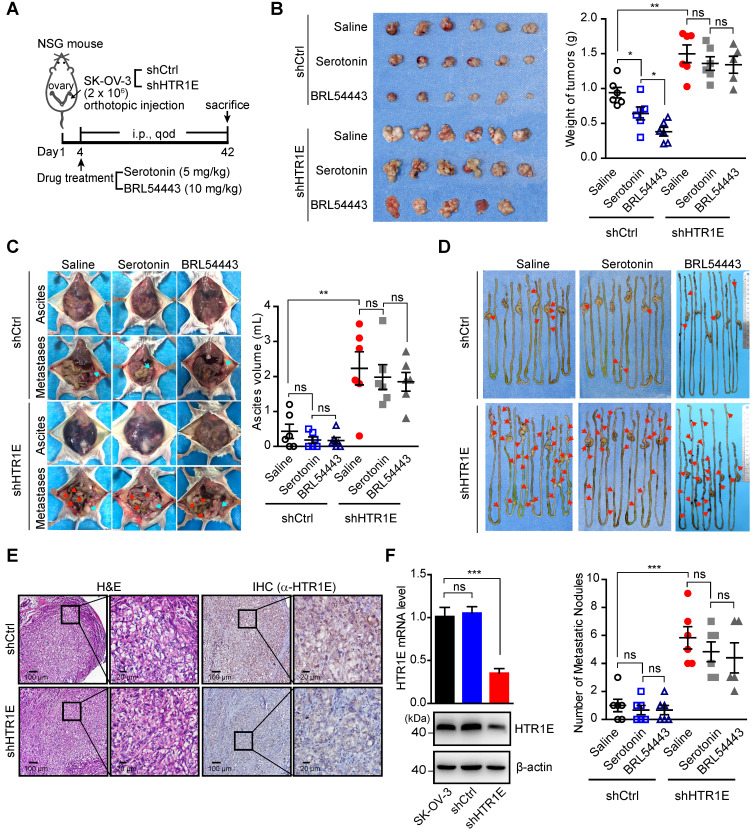
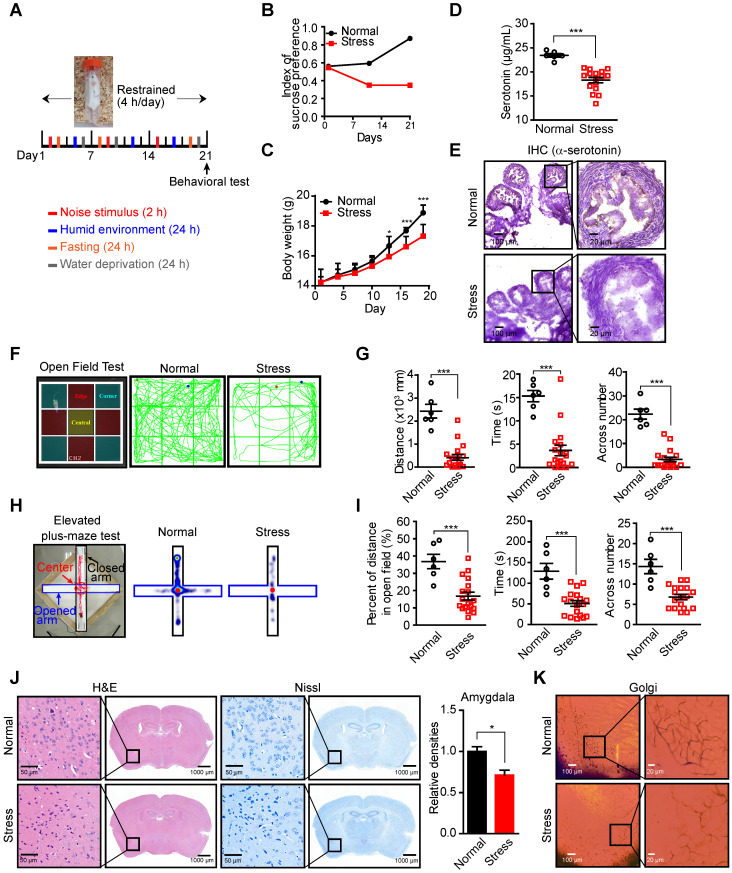
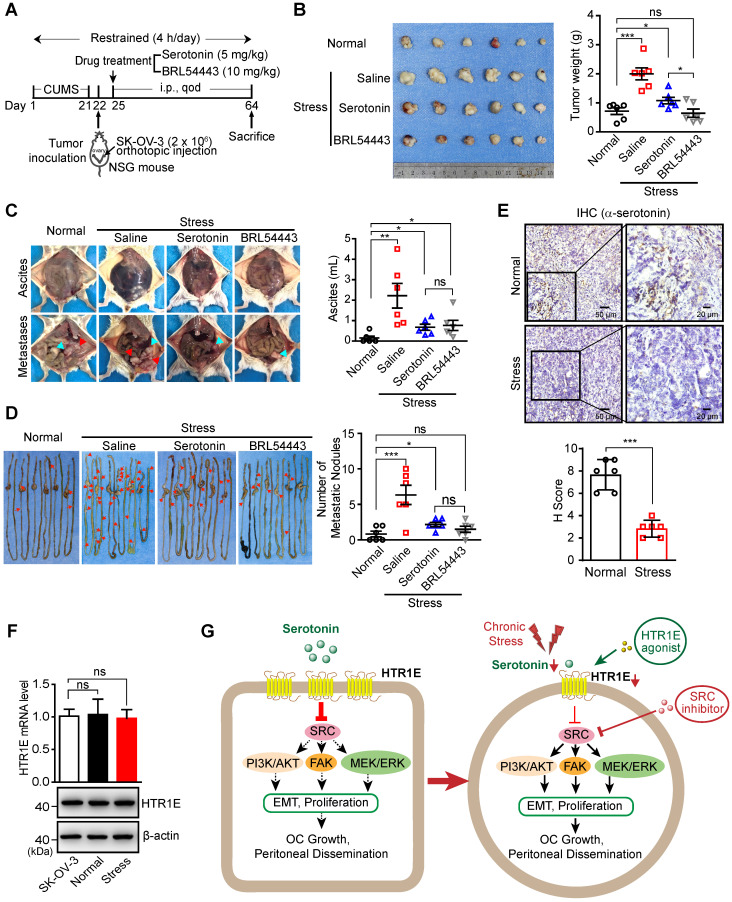
Rationale: Psychological stress has been linked to cancer development and resistance to therapy by many epidemiological and clinical studies. Stress-induced immunosuppressive microenvironment by stress hormones, in particular glucocorticoids, has been extensively studied. However, the impacts of other stress-related neurotransmitters, such as serotonin (5-hydroxytryptamine, 5-HT), on cancer development just start to be revealed. Here, we aimed to identify novel neurotransmitters involved in stress-induced growth and dissemination of ovarian cancer (OC) and reveal the major underlying signaling pathway and the therapeutic significance. Methods: Through a genome-wide CRISPR/Cas9 knockout screen in the murine orthotopic model of ovarian carcinoma (OC), we identified candidate genes regulating the peritoneal dissemination of OC. Among them, we picked out HTR1E, one member of 5-HT receptor family specifically expressed in the ovary and endometrium in addition to brain. The correlation of HTR1E expression with OC progression was analyzed in OC patient specimen by quantitative reverse transcription polymerase chain reaction (qRT-PCR), western blot, and immunohistochemistry (IHC). Gain-of-function and loss-of-function analyses were performed to explore the functions of 5-HT/HTR1E signaling in OC growth and dissemination in vitro and in vivo. In addition, we investigated the therapeutic values of HTR1E specific agonist and small molecular inhibitors against HTR1E downstream factor SRC in a stressed murine OC xenograft model. Results: In OC patients, the HTR1E expression is dramatically decreased in peritoneal disseminated OC cells, which correlates with poor clinical outcome. Silence of HTR1E in OC cells greatly promotes cell proliferation and epithelial mesenchymal transition (EMT) by the activation of SRC-mediated downstream signaling pathways. Furthermore, chronic stress results in significantly decreased serotonin in the ovary and the enhanced OC growth and peritoneal dissemination in mice, which can be strongly inhibited by specific HTR1E agonist or the SRC inhibitor. Conclusions: We discovered the essential role of serotonin/HTR1E signaling in preventing the chronic psychological stress-promoted progression of OC, suggesting the potential therapeutic value of the HTR1E specific agonist and the SRC inhibitor for OC patients who are suffering from psychological stress.

Keywords: HTR1E; SRC; chronic stress; ovarian cancer; serotonin.


Conflict of interest statement

Competing Interests: The authors have declared that no competing interest exists.

Figures

Figure 1
Figure 1
Genome-wide CRISPR screen identifies HTR1E as a key gene regulating OC peritoneal dissemination. (A) The schematic diagram of genome-wide in vivo screening of key genes regulating peritoneal dissemination by CRISPR/Cas9 library in an OC orthotopic murine model. (B) Scatterplot showing enrichment of specific sgRNAs in peritoneal disseminated (sgRNAPeri) or primary (sgRNAPri) OC xenografts (top panel) and the identification of top candidate genes using MAGeCK P value analysis (bottom panel). (C) The mRNA level of HTR1E in normal human ovarian tissues (n = 88) and OC specimens (n = 373) from Genotype-Tissue Expression (GTEx) database and TCGA database (***P < 0.001, by paired, two-tailed student's t-test). (D) Kaplan-Meier survival curve to show the overall survival (OS) of OC patients with different HTR1E expression (n = 1220). (E-F) qRT-PCR analysis of HTR1E in 20 human OC specimens (P) including 20 primary tumor samples (Pri) with 6 paired ascites samples (Asc) and 17 paired peritoneal OC metastatic nodules (Met) (E) and the statistical analysis on the change of HTR1E expression during OC metastasis (F) (means ± SEM from three independent experiments, *P < 0.05, ns not significant, by paired, two-tailed student's t-test). (G-H) Western blot analysis of HTR1E in human OC primary tumors and paired metastases and ascites from 20 OC patients (G) and the statistical analysis on the change of HTR1E protein during OC metastasis (H) (*P < 0.05, ***P < 0.001, by paired, two-tailed student's t-test). (I) H&E and IHC staining of HTR1E in the primary OC tumors and paired metastases dissected from human OC patients and the quantification by H score method (n = 20, ***P < 0.001, by paired, two-tailed student's t-test).
Figure 2
Figure 2
HTR1E inhibits the growth and peritoneal dissemination of OC xenografts in mice. (A) qRT-PCR and western blot showing the knockdown efficiencies of shRNAs targeting HTR1E (shHTR1E) (means ± SEM from three independent experiments, ***P < 0.001, by unpaired, two-tailed student's t-test). The shRNA targeting bacteria lacZ is used as a negative control (shCtrl). (B) qRT-PCR and western blot analysis of HTR1E in indicated OC cell lines (means ± SEM from three independent experiments, **P < 0.01, ***P < 0.001, by unpaired, two-tailed student's t-test). (C) Images of OC xenografts dissected from NSG mice orthotopically inoculated with indicated SK-OV-3 cells 42 days ago and the weights of the xenografts (n = 5 for each group, ***P < 0.001, by unpaired, two-tailed student's t-test). (D) Representative images of the abdominal parts of mice (left). The primary tumors and the metastatic nodules are indicated by blue and red arrows, respectively. The volumes of ascites in the peritoneal cavities were measured (right, n = 5 for each group, *P < 0.05, by unpaired, two-tailed student's t-test). (E) H&E staining of the primary OC xenografts and the metastatic nodules on the intestine. (F) Representative images of peritoneal metastatic nodules on the intestines (left) and the quantification (right, n = 5 for each group, *P < 0.05, by unpaired, two-tailed student's t-test).
Figure 3
Figure 3
HTR1E inhibits the proliferation and migration of OC cells. (A) The proliferation curves of SK-OV-3 cells transfected with indicated shRNAs in the medium containing basal level of serotonin (0.5 µM) (left) or 5 µM serotonin (right, means ± SEM from three independent experiments, ***P < 0.001, by two-way ANOVA test). (B) Cell proliferation curves of OVCAR5 cells transfected with empty vector (vector) or HTR1E and cultured in the presence of 5 µM serotonin (means ± SEM from three independent experiments; ***P < 0.001, by two-way ANOVA test). (C-D) Colony formation assay of SK-OV-3 (C) and OVCAR-5 (D) cells in the presence of 5 µM serotonin and the quantification. Data are shown as means ± SEM from three independent experiments (**P < 0.01, ***P < 0.001, by unpaired, two-tailed student's t-test). (E-F) Transwell cell migration assay of SK-OV-3 (E) and OVCAR-5 (F) cells in the presence of 5 µM serotonin and the quantification. Data are shown as means ± SEM from three independent experiments (***P < 0.001, by unpaired, two-tailed student's t-test). (G-H) Trajectory of single SK-OV-3 (G) and OVCAR-5 (H) cell cultured in the presence of 5 μM serotonin. The tracked cells of current displacement and average speeds of all cells are shown as means ± SEM from three independent experiments (***P < 0.001, by unpaired, two-tailed student's t-test).
Figure 4
Figure 4
HTR1E inhibits SRC-mediated pathways that promote cell proliferation and EMT. (A) Hypothesized signaling pathways triggered by serotonin/HTR1E based on GSEA analysis. (B) Western blot analysis of the activation of SRC in shHTR1E or shCtrl SK-OV-3 cells. (C) Western blot analysis of the activation of SRC and ERK in SK-OV-3 cells in the presence of serotonin and SRC inhibitor (SRCi, 1 µM) or MEK inhibitor (MEKi, 1 µM). (D) Cell proliferation curves of SK-OV-3 cells in the presence of serotonin (5 µM) with or without SCRi (1 µM) or MEKi (1 µM) (means ± SEM from three independent experiments, ***P < 0.001, by two-way ANOVA test). (E) Colony formation assays of SK-OV-3 cells in the presence of serotonin with or without SCRi (1 µM) or MEKi (1 µM) (means ± SEM from three independent experiments, ***P < 0.001, ns not significant, by unpaired, two-tailed student's t-test). (F) Western blot analysis of EMT markers in indicated SK-OV-3 cells in the presence of serotonin and SRCi (1 µM). (G) The motility of indicated SK-OV-3 cells in the presence of serotonin and SRCi (1 µM) analyzed by High-Content Imaging and Harmony analysis system (means ± SEM from three independent experiments, ***P < 0.001, ns not significant, by unpaired, two-tailed student's t-test). (H-I) Western blot (H) and IHC (I) analysis of the EMT markers and the activation of SRC and ERK in the primary OC xenografts (Pri) and the peritoneal metastases (Met) dissected from the SK-OV-3 orthotopic murine model of OC. The quantification by H score method is analyzed by paired, two-tailed student's t-test (n = 6, *P < 0.05, ***P < 0.001). (J) IHC analysis of human primary OC specimens (Pri) and paired peritoneal metastases (Met) for HTR1E and EMT markers. The correlation between HTR1E and EMT markers is analyzed by paired, two-tailed student's t-test (n = 13, ***P < 0.001).
Figure 5
Figure 5
Serotonin inhibits OC development in mice in an HTR1E-dependent manner. (A) Schematic of the experiment. (B) Images of the primary OC xenografts formed by orthotopic inoculation of HTR1E-silenced or control SK-OV-3 cells with indicated treatments (left) and the tumor weights (right) (shown as means ± SEM; n = 6 for each group; *P < 0.05, **P < 0.01, ns not significant, by unpaired, two-tailed student's t-test). (C) Representative images of the abdominal parts of mice with indicated OC xenografts (left) and the quantification of the ascites volumes (right; shown as means ± SEM; n = 6 for each group; **P < 0.01, ns not significant, by unpaired, two-tailed student's t-test). (D) Images of OC metastatic nodules on the intestines (top panel) and the quantification (bottom panel; shown as means ± SEM; n = 6 for each group; ***P < 0.001, ns not significant, by unpaired, two-tailed student's t-test). (E) H&E and IHC staining of HTR1E in the primary OC xenografts formed by orthotopic inoculation of HTR1E-silenced or control SK-OV-3 cells. (F) qRT-PCR and western blot showing the knock-down efficiencies of shRNAs targeting HTR1E (shHTR1E) in SK-OV-3 cells used in the orthotopic murine model of OC (means ± SEM from three independent experiments, ***P < 0.001, by unpaired, ns not significant, two-tailed student's t-test).
Figure 6
Figure 6
Decreased serotonin in the peripheral blood serum and ovary of mice in CUMS model. (A) Schematic of the CUMS model. (B-C) Sucrose consumption ratio in the sucrose preference test (B) and body weights (C) (n = 6 in Normal group, n = 18 in Stress group, shown as means ± SEM; *P < 0.05, ***P < 0.001, by unpaired, two-tailed student's t-test). (D) Serum serotonin levels measured by ELISA (n = 6 in Normal group, n = 18 in Stress group, shown as means ± SEM; ***P < 0.001, by unpaired, two-tailed student's t-test). (E) Ovary serotonin levels measured by IHC staining in mice with or without stress stimulation for 21 days. (F) Zoning diagram of open-field test (left) and representative locomotion tracks (green lines) of mice in the normal group and mice under stress (right). (G) The locomotion distance, residence time and the number across center area are compared between mice in the normal group and stress group (shown as means ± SEM; ***P < 0.001, by unpaired, two-tailed student's t-test). (H) Zoning diagram of elevated high-plus maze test (left) and representative locomotion heat map of mice in normal group and stress group (right). (I) The time spent in the open arm area and the number across the center area are compared (shown as means ± SEM; ***P < 0.001, by unpaired, two-tailed student's t-test). (J) H&E and Nissl staining of neuron cells in amygdala of mice in normal and stress groups (left). The quantification of relative densities of neuron cells in amygdala of mice (shown as means ± SEM; *P < 0.05, by unpaired, two-tailed student's t-test). (K) Golgi staining of nerve synapse in amygdala of mice in normal and stress groups.
Figure 7
Figure 7
Activation of Serotonin/HTR1E signaling reduces chronic stress-induced OC progression in mice. (A) Schematic of the experiments (n = 6 in Normal group, n = 18 in Stress group). (B) Images of OC xenografts at the primary sites dissected from SK-OV-3 orthotopic murine model of OC with indicated treatments (left) and the tumor weights (right; n = 6 in each group; shown as means ± SEM; P < 0.05, ***P < 0.001, ns not significant, by unpaired, two-tailed student's t-test). (C) Representative images of the abdominal parts of mice with OC xenografts under indicated treatments (left) and the quantification of the ascites volumes (right; n = 6 in each group; shown as means ± SEM; *P < 0.05, **P < 0.01, ns not significant, by unpaired, two-tailed student's t-test). (D) Images of the metastatic nodules on the intestines of mice with OC xenografts under indicated treatments (left) and the quantification (right; n = 6 in each group; shown as means ± SEM; *P < 0.05, ***P < 0.001, ns not significant, by unpaired, two-tailed student's t-test). (E) Serum serotonin levels measured by IHC staining (top panel) in OC mice with or without stress stimulation and the quantification (bottom panel) by H score method (n = 6, ***P < 0.001, by unpaired, two-tailed student's t-test). (F) qRT-PCR and western blot showing the HTR1E mRNA and protein levels of tumor tissues in the orthotopic murine model of OC (means ± SEM from three independent experiments, ns not significant, two-tailed student's t-test). (G) Schematics summarizing the HTR1E-mediated signaling of serotonin in preventing the progression of OC.

Similar articles

Cited by

References

    1. Siegel RL, Miller KD, Jemal A. Cancer statistics, 2019. CA: A Cancer Journal for Clinicians. 2019. 69. - PubMed
    1. Watts S, Prescott P, Mason J, McLeod N, Lewith G. Depression and anxiety in ovarian cancer: a systematic review and meta-analysis of prevalence rates. BMJ Open. 2015;5:e007618. - PMC - PubMed
    1. Reiche EM, Nunes SO, Morimoto HK. Stress, depression, the immune system, and cancer. Lancet Oncol. 2004;5:617–25. - PubMed
    1. Meraner V, Gamper EM, Grahmann A, Giesinger JM, Wiesbauer P, Sztankay M. et al. Monitoring physical and psychosocial symptom trajectories in ovarian cancer patients receiving chemotherapy. BMC Cancer. 2012;12:77. - PMC - PubMed
    1. Guereschi MG, Araujo LP, Maricato JT, Takenaka MC, Nascimento VM, Vivanco BC. et al. Beta2-adrenergic receptor signaling in CD4+ Foxp3+ regulatory T cells enhances their suppressive function in a PKA-dependent manner. Eur J Immunol. 2013;43:1001–12. - PubMed

Publication types

MeSH terms