

Vibrational characterization of a diiron bridging hydride complex - a model for hydrogen catalysis
- PMID: 34094075
- PMCID: PMC8159291
- DOI: 10.1039/d0sc01290d
Vibrational characterization of a diiron bridging hydride complex - a model for hydrogen catalysis
Abstract
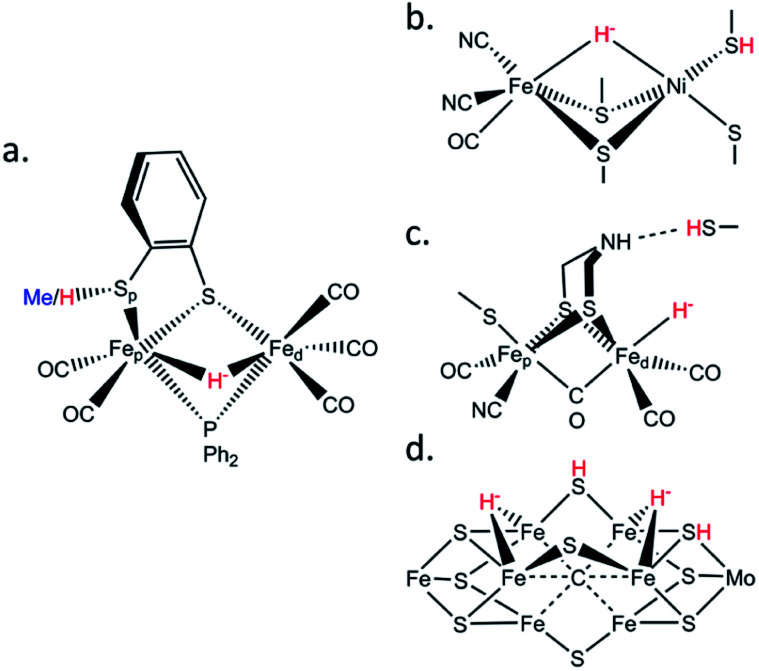
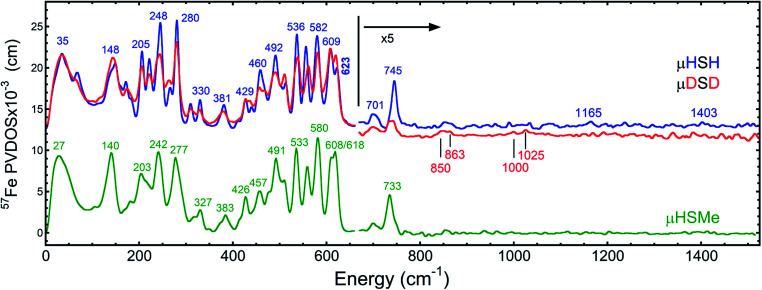
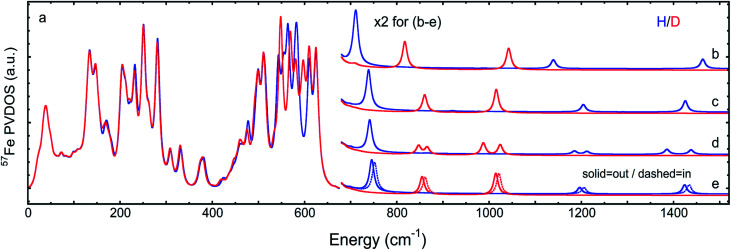
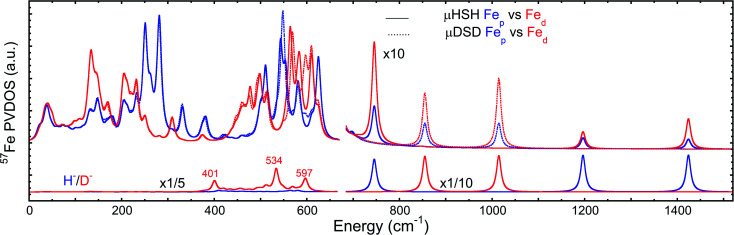
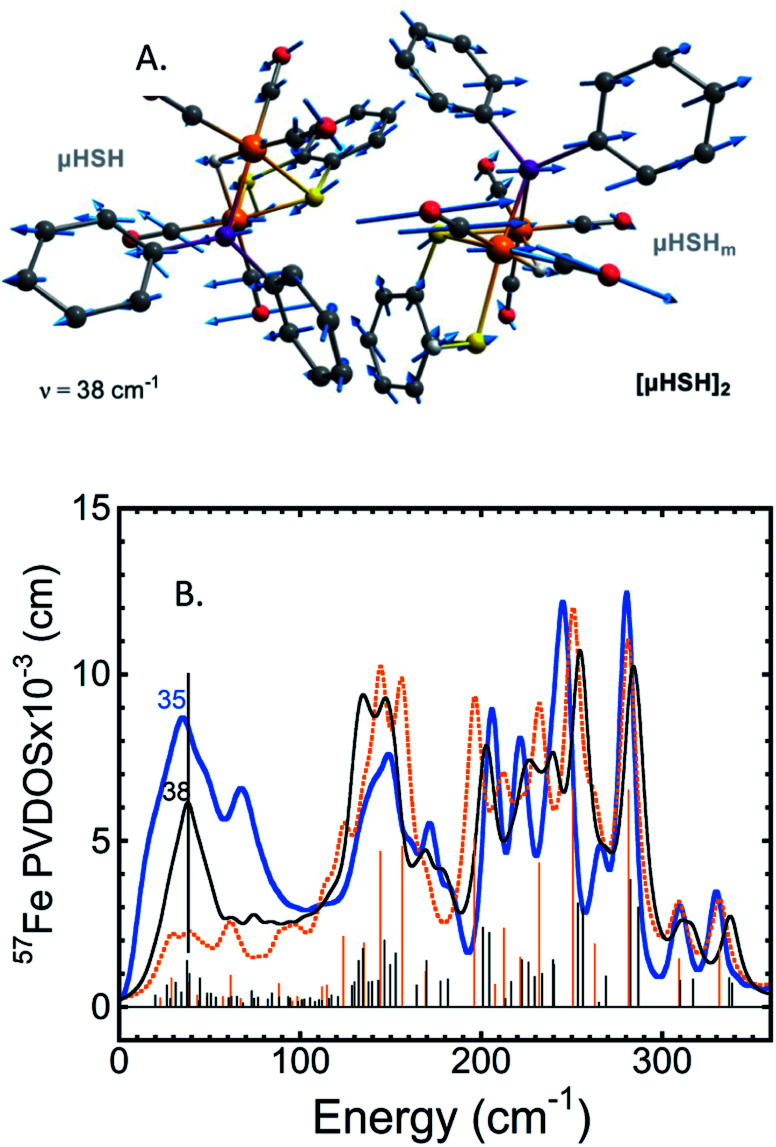
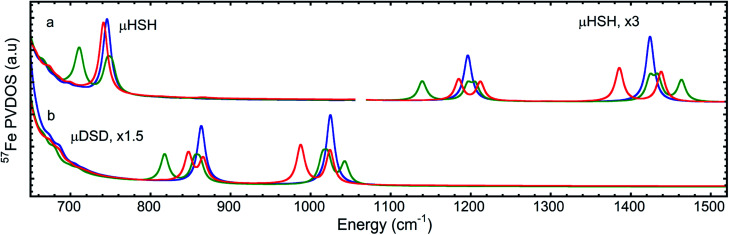
A diiron complex containing a bridging hydride and a protonated terminal thiolate of the form [(μ,κ2-bdtH)(μ-PPh2)(μ-H)Fe2(CO)5]+ has been investigated through 57Fe nuclear resonance vibrational spectroscopy (NRVS) and interpreted using density functional theory (DFT) calculations. We report the Fe-μH-Fe wagging mode, and indications for Fe-μD stretching vibrations in the D-isotopologue, observed by 57Fe-NRVS. Our combined approach demonstrates an asymmetric sharing of the hydride between the two iron sites that yields two nondegenerate Fe-μH/D stretching vibrations. The studied complex provides an important model relevant to biological hydrogen catalysis intermediates. The complex mimics proposals for the binuclear metal sites in [FeFe] and [NiFe] hydrogenases. It is also an appealing prototype for the 'Janus intermediate' of nitrogenase, which has been proposed to contain two bridging Fe-H-Fe hydrides and two protonated sulfurs at the FeMo-cofactor. The significance of observing indirect effects of the bridging hydride, as well as obstacles in its direct observation, is discussed in the context of biological hydrogen intermediates.
This journal is © The Royal Society of Chemistry.
Conflict of interest statement
There are no conflicts to declare.
Figures
Similar articles
-
High-Frequency Fe-H Vibrations in a Bridging Hydride Complex Characterized by NRVS and DFT.Angew Chem Int Ed Engl. 2018 Jul 20;57(30):9367-9371. doi: 10.1002/anie.201804601. Epub 2018 Jun 25. Angew Chem Int Ed Engl. 2018. PMID: 29847703 Free PMC article.
-
Key hydride vibrational modes in [NiFe] hydrogenase model compounds studied by resonance Raman spectroscopy and density functional calculations.Inorg Chem. 2012 Nov 5;51(21):11787-97. doi: 10.1021/ic3017276. Epub 2012 Oct 5. Inorg Chem. 2012. PMID: 23039071
-
Differential Protonation at the Catalytic Six-Iron Cofactor of [FeFe]-Hydrogenases Revealed by 57Fe Nuclear Resonance X-ray Scattering and Quantum Mechanics/Molecular Mechanics Analyses.Inorg Chem. 2019 Mar 18;58(6):4000-4013. doi: 10.1021/acs.inorgchem.9b00100. Epub 2019 Feb 25. Inorg Chem. 2019. PMID: 30802044
-
Isomerization of the hydride complexes [HFe2(SR)2(PR3)(x)(CO)(6-x)]+ (x = 2, 3, 4) relevant to the active site models for the [FeFe]-hydrogenases.Dalton Trans. 2010 Mar 28;39(12):3011-9. doi: 10.1039/b910147k. Epub 2009 Sep 16. Dalton Trans. 2010. PMID: 20221534 Free PMC article.
-
Photoinduced Terminal Hydride of [FeFe]-Hydrogenase Biomimetic Complexes.Inorg Chem. 2019 Oct 21;58(20):13737-13741. doi: 10.1021/acs.inorgchem.9b01738. Epub 2019 Sep 30. Inorg Chem. 2019. PMID: 31566967
Cited by
-
High-Frequency Fe-H and Fe-H2 Modes in a trans-Fe(η2-H2)(H) Complex: A Speed Record for Nuclear Resonance Vibrational Spectroscopy.Inorg Chem. 2021 Jan 18;60(2):555-559. doi: 10.1021/acs.inorgchem.0c03006. Epub 2020 Dec 23. Inorg Chem. 2021. PMID: 33356182 Free PMC article.
-
Wavelength dependent photochemistry of an iron dinitrogen hydride complex via multiple spectroscopies - competing ejection of axial ligands.Chem Sci. 2025 Jul 17;16(32):14760-14770. doi: 10.1039/d5sc03870g. eCollection 2025 Aug 13. Chem Sci. 2025. PMID: 40687694 Free PMC article.
-
Temperature-dependent iron motion in extremophile rubredoxins - no need for 'corresponding states'.Sci Rep. 2024 May 28;14(1):12197. doi: 10.1038/s41598-024-62261-2. Sci Rep. 2024. PMID: 38806591 Free PMC article.
-
Integrated bio-metal science: New frontiers of bio-metal science opened with cutting-edge techniques.Biophys Physicobiol. 2020 Aug 28;17:94-97. doi: 10.2142/biophysico.BSJ-2020017. eCollection 2020. Biophys Physicobiol. 2020. PMID: 33194510 Free PMC article. No abstract available.
-
Nuclear Resonance Vibrational Spectroscopy: A Modern Tool to Pinpoint Site-Specific Cooperative Processes.Crystals (Basel). 2021 Aug;11(8):909. doi: 10.3390/cryst11080909. Epub 2021 Aug 2. Crystals (Basel). 2021. PMID: 35582460 Free PMC article.
References
Grants and funding
LinkOut - more resources
Full Text Sources
Research Materials