. 2020 May 27;11(22):5819-5829.
doi: 10.1039/d0sc01255f.

Investigation of cellular uptake mechanism of functionalised gold nanoparticles into breast cancer using SERS

Affiliations

Investigation of cellular uptake mechanism of functionalised gold nanoparticles into breast cancer using SERS

Anastasia Kapara et al. Chem Sci. .

Abstract

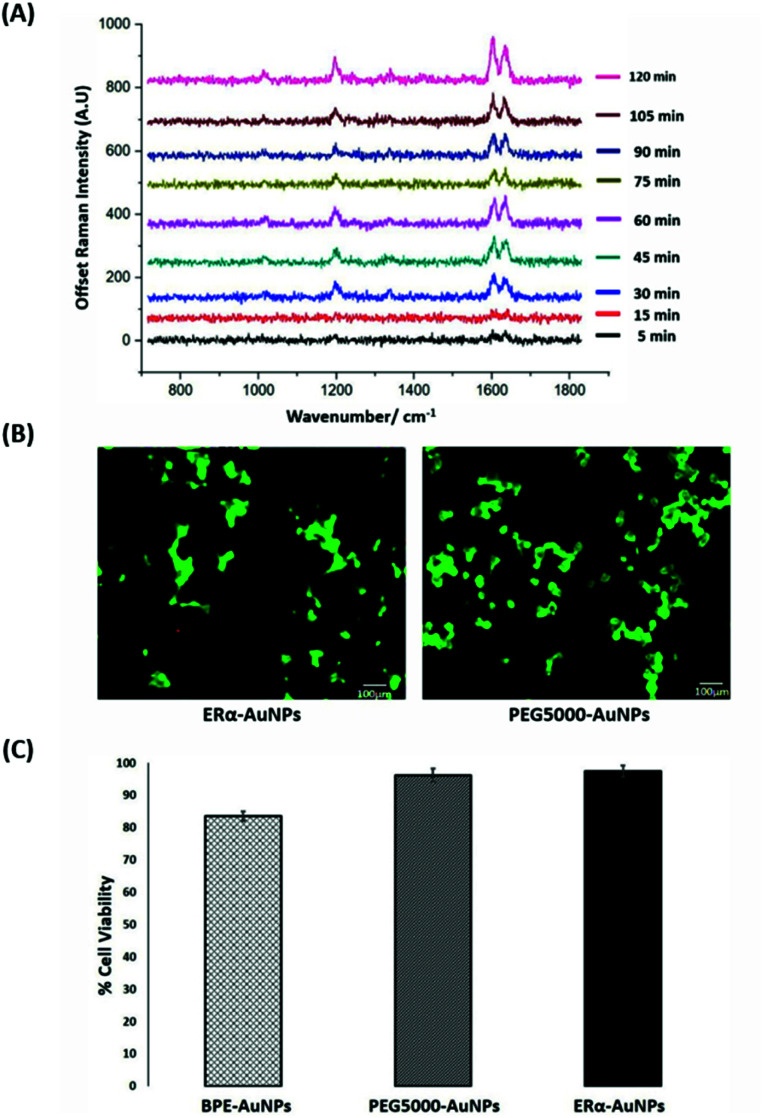
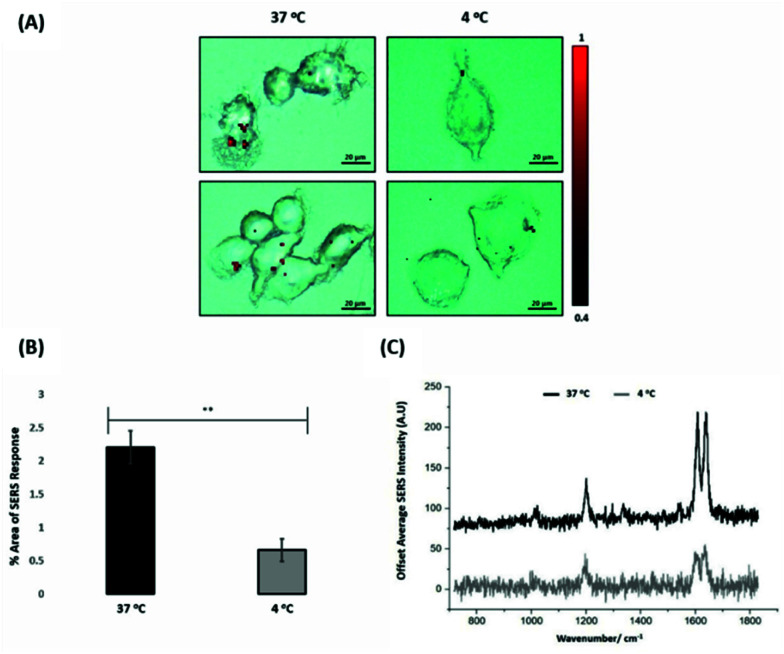
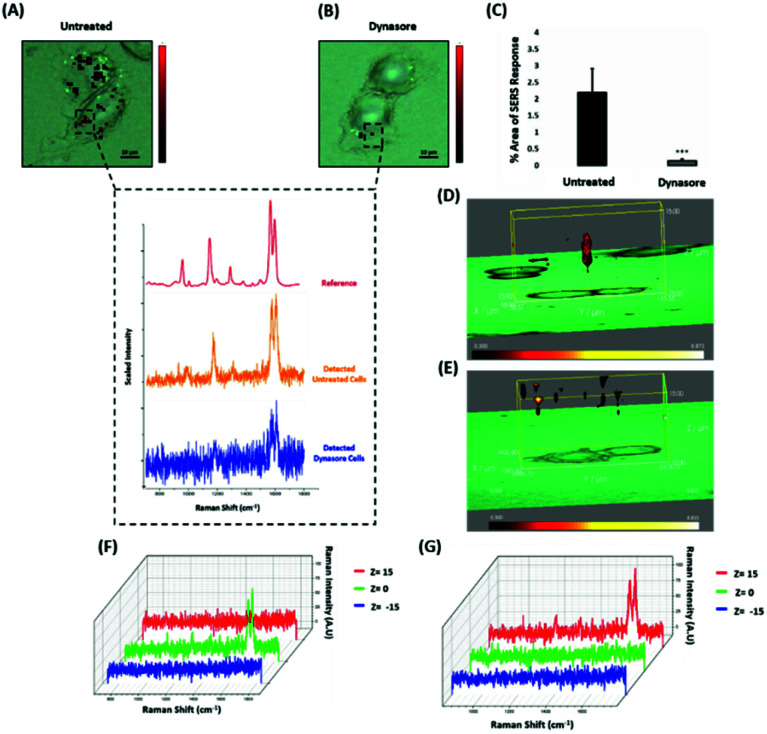
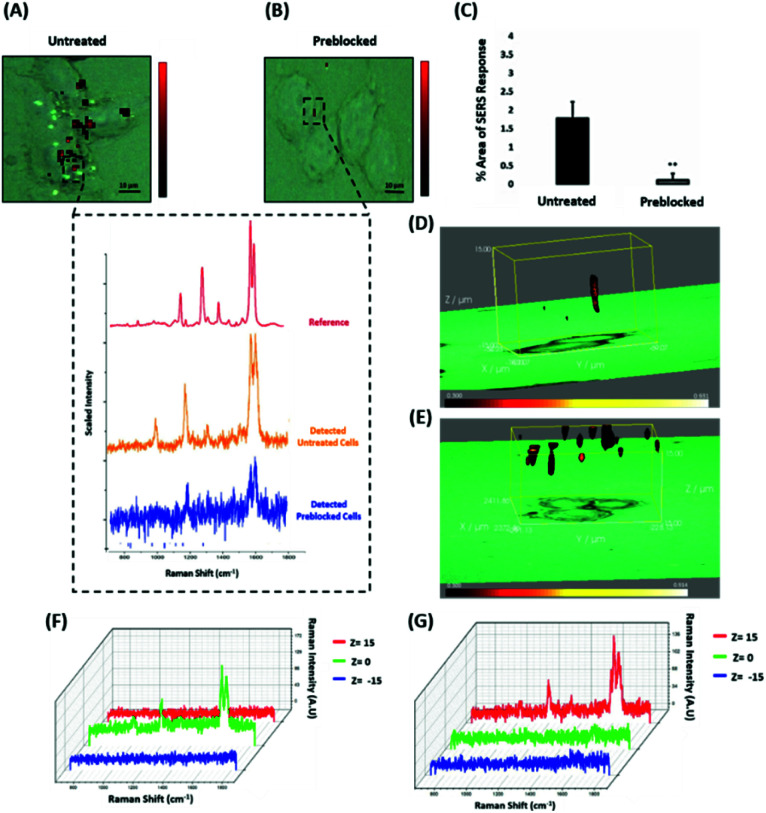
Gold nanoparticles (AuNPs) are widely used in various applications such as cancer imaging and drug delivery. The functionalisation of AuNPs has been shown to affect their cellular internalisation, accumulation and targeting efficiency. The mechanism of cellular uptake of functionalised AuNPs by different cancer cells is not well understood. Therefore, a detailed understanding of the molecular processes is necessary to improve AuNPs for their selective uptake and fate in specific cellular systems. This knowledge can greatly help in designing nanotags with higher cellular uptake for more selective and specific targeting capabilities with less off-target effects. Here, we demonstrate for the first time a straightforward and non-destructive 3D surface enhanced Raman spectroscopy (SERS) imaging approach to track the cellular uptake and localisation of AuNPs functionalised with an anti-ERα (estrogen receptor alpha) antibody in MCF-7 ERα-positive human breast cancer cells under different conditions including temperature and dynamin inhibition. 3D SERS enabled information rich monitoring of the intracellular internalisation of the SERS nanotags. It was found that ERα-AuNPs were internalised by MCF-7 cells in a temperature-dependent manner suggesting an active endocytosis-dependent mechanism. 3D SERS cell mapping also indicated that the nanotags entered MCF-7 cells using dynamin dependent endocytosis, since dynamin inhibition resulted in the SERS signal being obtained from, or close to, the cell surface rather than inside the cells. Finally, ERα-AuNPs were found to enter MCF-7 cells using an ERα receptor-mediated endocytosis process. This study addresses the role of functionalisation of SERS nanotags in biological environments and highlights the benefits of using 3D SERS for the investigation of cellular uptake processes.


Conflict of interest statement

There are no conflicts to declare.

Figures

Fig. 1
Fig. 1. ERα-AuNPs incubated in MCF-7 cells showed strong SERS signal with no detectable cell toxicity. (A) Average SERS signal from ERα-AuNPs in MCF-7 cells under different nanotag incubation times ranging from 5 min to 120 min. SERS spectra were collected in fixed MCF-7 cells using a Renishaw InVia system combined with edge Streamline HR high confocality mode at 1 μm resolution in the X and Y directions. A 50× magnification NIR APO Nikon water immersion objective with a 0.75 NA was used on the samples at a laser power of 1.2 mW (10% power) at the sample, from a HeNe 633 nm excitation source with a 0.1 s acquisition time per point, and a 1200 L mm−1 grating in high confocality mode. Windows-based Raman Environment (WiRE™ – Renishaw plc) 4.4 software package was used to pre-process the data for cosmic ray removal and baseline subtraction. (B) Cell viability assay of MCF-7 cells treated with 60 pM ERα-AuNPs (left) and 60 pM PEG5000-AuNPs (nanotags without ERα antibody functionalisation) (right) for 48 h using live/dead staining with Calcein AM and EthD Br-1 assay. Viable cells appear as green (Calcein AM), while non-viable cells appear as red (EthD Br-1). Scale bar 100 μm. (C) Cell viability using trypan blue assay for MCF-7 cells treated with 60 pM BPE-AuNPs, 60 pM PEG5000-AuNPs or 60 pM ERα-AuNPs for 48 h. The average of ten samples from three independent biological replicates is shown. Error bars presented as mean ± standard deviation (SD).
Fig. 2
Fig. 2. Calculation of relative SERS response value under different ERα-AuNPs concentrations. The calculations were carried out using WiRE™ – Renishaw plc 4.4 and Fiji image processing package. The average of ten samples from three independent biological replicates is shown. Error bars presented as mean ± SD.
Fig. 3
Fig. 3. ERα-AuNPs enter MCF-7 cells in a temperature dependent manner (A) SERS map of MCF-7 cells treated with ERα-AuNPs (60 pM) for 2 h at 37 °C (left) and 4 °C (right). The images were generated using a Renishaw InVia Raman microscope with 50× magnification NIR APO Nikon water immersion objective with a 0.75 NA and 1.2 mW laser power (10% power) from a HeNe 633 nm excitation source with step size y,x 1.0 μm, 0.1 s acquisition time and a 1200 L mm−1 grating in high confocality mode. The red false colour images, representing ERα-AuNPs, were generated using WiRE™ Renishaw plc 4.4 software and direct classical least square analysis (DCLS) based on a BPE Raman reporter spectrum. Results are representative of 3 independent experiments (SERS mapping of 10 cells in each experiment). Scale bars = 20 μm. (B) Percentage of relative SERS response value in MCF-7 cells incubated with ERα-AuNPs (60 pM for 2 h) at 37 °C (black) and 4 °C (grey). The area was calculated using the Fiji image processing package by calculating the red pixel number, corresponding to ERα-AuNPs, and the mapped cell area. The average of ten samples from three independent biological replicates is shown. Error bars presented as mean ± SD. *Significant difference (p < 0.05) in a Student's t-test. (C) Representative average SERS spectra of MCF-7 cells incubated with ERα-AuNPs (60 pM for 2 h) at 37 °C (black) and 4 °C (grey) calculated from 10 cells of 3 independent experiments.
Fig. 4
Fig. 4. ERα-AuNPs use dynamin for their cellular uptake in MCF-7 cells. (A) False colour SERS map images for MCF-7 cells incubated with only ERα-AuNP nanotags (60 pM, 2 h) or (B) with ERα-AuNP nanotags (60 pM, 2 h) and dynasore (80 μM, 30 min). The inset (dashed box) shows the average SERS spectra from untreated (orange) and dynasore treated (blue) cells, stacked with BPE Raman reporter reference spectrum (attached on ERα-AuNPs) (red). The images were generated using a Renishaw InVia Raman microscope with 50× magnification NIR APO Nikon water immersion objective with a 0.75 NA and 1.2 mW laser power (10% power) from a HeNe 633 nm excitation source with step size y,x 1.0 μm, 0.1 s acquisition time and a 1200 L mm−1 grating in high confocality mode. Scale bar = 10 μm. (C) Calculation of relative SERS response value for MCF-7 cells incubated with ERα-AuNPs (60 pM, 2 h) or with dynasore (80 μM, 30 min) and ERα-AuNP nanotags (60 pM, 2 h). The calculations were carried out using WiRE™ – Renishaw plc 4.4 and Fiji image processing package. The average from three independent biological replicates is shown. Error bars presented as mean ± SD. (D) 3D SERS map from MCF-7 treated with only ERα-AuNPs (60 pM, 2 h) or (E) with dynasore (80 μM, 30 min) and ERα-AuNP nanotags (60 pM, 2 h). 3D SERS images were generated using the same conditions as those stated above for 2D mapping (Fig. 4A and B) except a step size of z = 3.0 was also employed. (F) 3D Raman mapping waterfall plot of average SERS spectra at different z-axis points, z = 15 μm (red), z = 0 μm (green) and z = −15 μm (blue) from MCF-7 treated with only ERα-AuNPs (60 pM, 2 h) or (G) with dynasore (80 μM, 30 min) and ERα-AuNP nanotags (60 pM, 2 h).
Fig. 5
Fig. 5. ERα-AuNPs use mERα for their cellular uptake in MCF-7 cells. (A) False colour SERS map images for MCF-7 cells incubated with ERα-AuNPs (60 pM, 2 h) or (B) pre-blocked with free anti-ERα antibody (10 μg mL−1, 1 h) and then treated with ERα-AuNPs (60 pM, 2 h). The inset (dashed box) shows the average SERS spectra from untreated (orange) and pre-blocked with free anti-ERα antibody (blue) cells stacked with reference spectrum from nanotags (red). The images were generated using a Renishaw InVia Raman microscope with 50× magnification NIR APO Nikon water immersion objective with a 0.75 NA and 1.2 mW laser power (10% power) from a HeNe 633 nm excitation source with step size y,x 1.0 μm, 0.1 s acquisition time and a 1200 L mm−1 grating in high confocality mode. Scale bar = 10 μm. (C) Calculation of relative SERS response value for MCF-7 cells incubated with ERα-AuNPs (60 pM, 2 h) or pre-blocked with free anti-ERα antibody (10 μg mL−1, 1 h) and then treated with ERα-AuNPs (60 pM, 2 h). The calculations were carried out using WiRE™ – Renishaw plc 4.4 and Fiji image processing package. The average from three independent biological replicates is shown. Error bars presented as mean ± SD. (D) 3D SERS map from MCF-7 cells treated with ERα-AuNPs (60 pM, 2 h) and (E) MCF-7 cells pre-blocked with free anti-ERα antibody (10 μg mL−1, 1 h) and then treated with ERα-AuNPs (60 pM, 2 h). 3D SERS images were generated using the same conditions as those stated above for 2D mapping (Fig. 5A and B) except a step size of z = 3.0 was also employed. (F) 3D Raman mapping waterfall plot of average SERS spectra into different z-axis points, z = 15 μm (red), z = 0 μm (green) and z = −15 μm (blue) from MCF-7 cells treated with only ERα-AuNPs (60 pM, 2 h) or (G) with free anti-ERα antibody (10 μg mL−1, 1 h) and then treated with ERα-AuNPs (60 pM, 2 h).

Similar articles

Cited by

References

    1. Laing S. Gracie K. Faulds K. Chem. Soc. Rev. 2016;45:1901–1918. doi: 10.1039/C5CS00644A. - DOI - PubMed
    1. Noonan J. Asiala S. M. Grassia G. MacRitchie N. Gracie K. Carson J. Moores M. Girolami M. Bradshaw A. C. Guzik T. J. Meehan G. R. Scales H. E. Brewer J. M. McInnes I. B. Sattar N. Faulds K. Garside P. Graham D. Maffia P. Theranostics. 2018;8:6195–6209. doi: 10.7150/thno.28665. - DOI - PMC - PubMed
    1. Smith B. R. Gambhir S. S. Chem. Rev. 2017;117:901–986. doi: 10.1021/acs.chemrev.6b00073. - DOI - PubMed
    1. Dutta D. Donaldson J. G. Cell. Logist. 2012;2:203–208. doi: 10.4161/cl.23967. - DOI - PMC - PubMed
    1. Shang L. Nienhaus K. Nienhaus G. U. J. Nanobiotechnol. 2014;12:2388–2397. doi: 10.1186/1477-3155-12-5. - DOI - PMC - PubMed