

A conductive metal-organic framework photoanode
- PMID: 34094225
- PMCID: PMC8162193
- DOI: 10.1039/d0sc04302h
A conductive metal-organic framework photoanode
Abstract
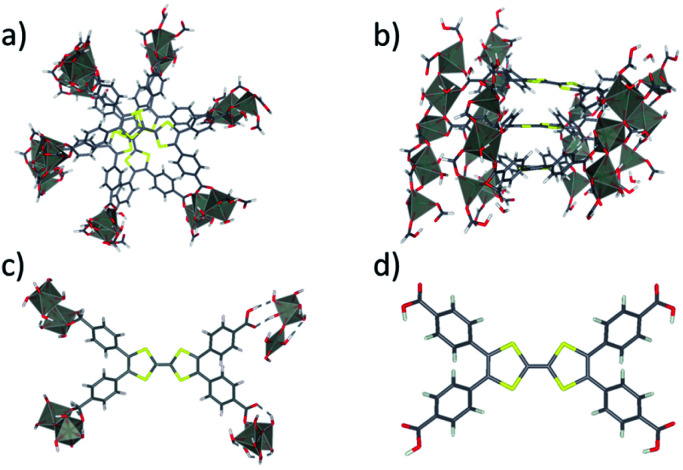
We report the development of photosensitizing arrays based on conductive metal-organic frameworks (MOFs) that enable light harvesting and efficient charge separation. Zn2TTFTB (TTFTB = tetrathiafulvalene tetrabenzoate) MOFs are deposited directly onto TiO2 photoanodes and structurally characterized by pXRD and EXAFS measurements. Photoinduced interfacial charge transfer dynamics are investigated by combining time-resolved THz spectroscopy and quantum dynamics simulations. Sub-600 fs electron injection into TiO2 is observed for Zn2TTFTB-TiO2 and is compared to the corresponding dynamics for TTFTB-TiO2 analogues that lack the extended MOF architecture. Rapid electron injection from the MOF into TiO2 is enhanced by facile migration of the hole away from the interfacial region. Holes migrate through strongly coupled HOMO orbitals localized on the tetrathiafulvalene cores of the columnar stacks of the MOF, whereas electrons are less easily transferred through the spiral staircase arrangement of phenyl substituents of the MOF. The reported findings suggest that conductive MOFs could be exploited as novel photosensitizing arrays in applications to slow, and thereby make difficult, photocatalytic reactions such as those required for water-splitting in artificial photosynthesis.
This journal is © The Royal Society of Chemistry.
Conflict of interest statement
There are no conflicts to declare.
Figures


Similar articles
-
Charge Transport in Zirconium-Based Metal-Organic Frameworks.Acc Chem Res. 2020 Jun 16;53(6):1187-1195. doi: 10.1021/acs.accounts.0c00106. Epub 2020 May 13. Acc Chem Res. 2020. PMID: 32401008
-
Redox-Active Metal-Organic Frameworks with Three-Dimensional Lattice Containing the m-Tetrathiafulvalene-Tetrabenzoate.Molecules. 2022 Jun 23;27(13):4052. doi: 10.3390/molecules27134052. Molecules. 2022. PMID: 35807293 Free PMC article.
-
High charge mobility in a tetrathiafulvalene-based microporous metal-organic framework.J Am Chem Soc. 2012 Aug 8;134(31):12932-5. doi: 10.1021/ja3059827. Epub 2012 Jul 31. J Am Chem Soc. 2012. PMID: 22827709
-
Conjugated π Electrons of MOFs Drive Charge Separation at Heterostructures Interface for Enhanced Photoelectrochemical Water Oxidation.Small. 2021 Apr;17(14):e2100367. doi: 10.1002/smll.202100367. Epub 2021 Mar 10. Small. 2021. PMID: 33690986 Review.
-
Time-Resolved Spectroscopy for Dynamic Investigation of Photoresponsive Metal-Organic Frameworks.J Phys Chem Lett. 2024 Mar 28;15(12):3390-3403. doi: 10.1021/acs.jpclett.4c00296. Epub 2024 Mar 19. J Phys Chem Lett. 2024. PMID: 38501970 Review.
References
LinkOut - more resources
Full Text Sources