

Probing metabolic alterations in breast cancer in response to molecular inhibitors with Raman spectroscopy and validated with mass spectrometry
- PMID: 34094246
- PMCID: PMC8162119
- DOI: 10.1039/d0sc02221g
Probing metabolic alterations in breast cancer in response to molecular inhibitors with Raman spectroscopy and validated with mass spectrometry
Abstract
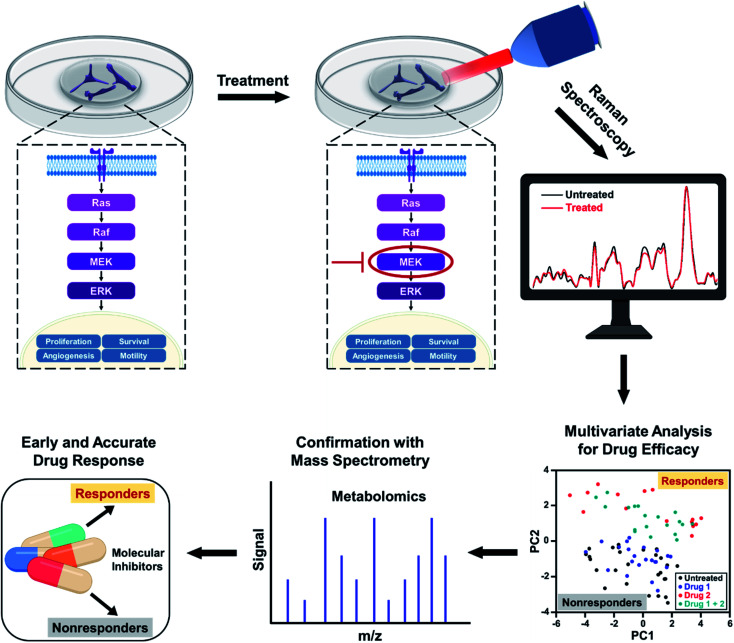
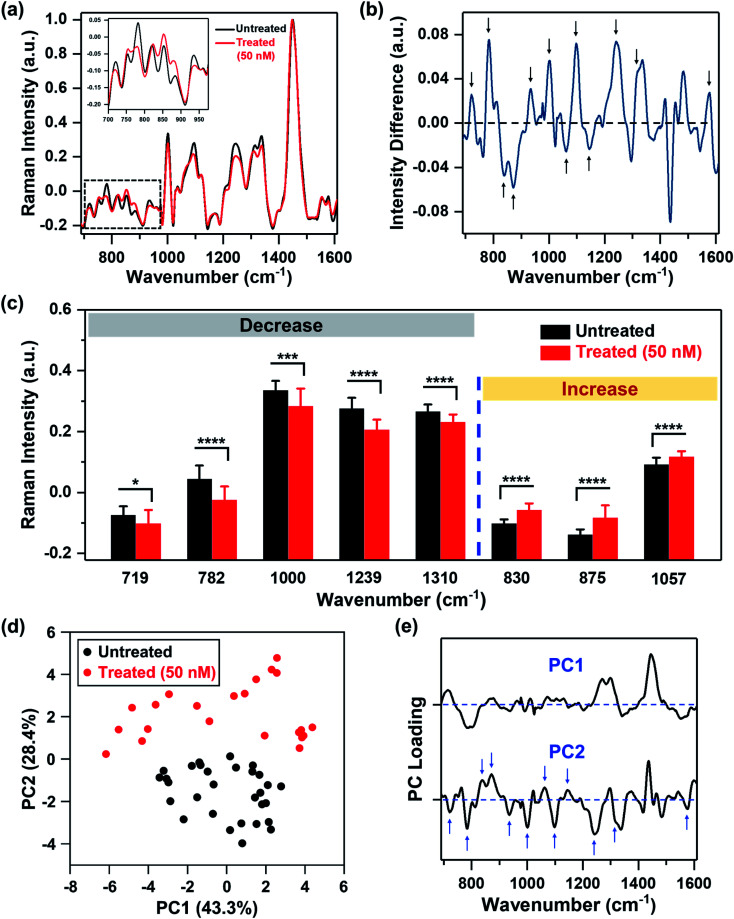
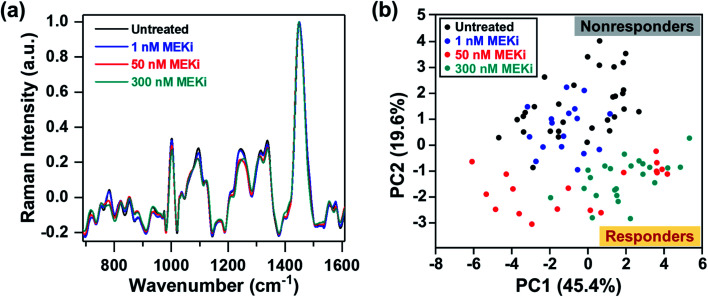
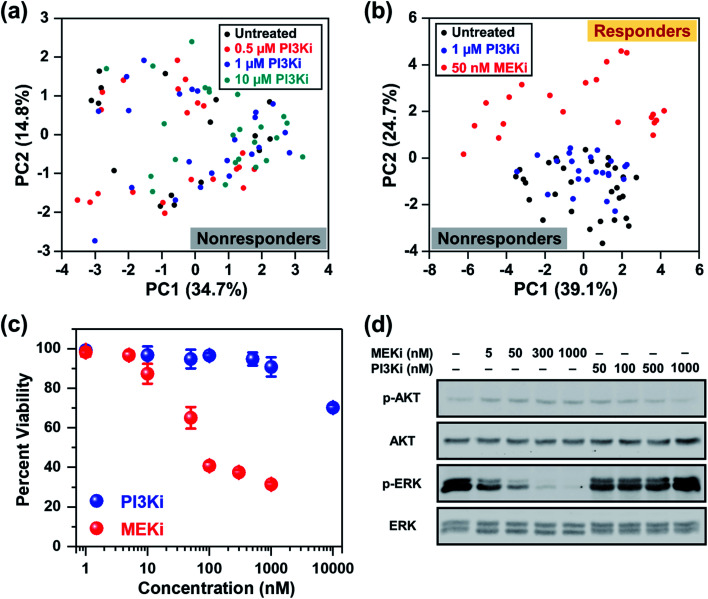
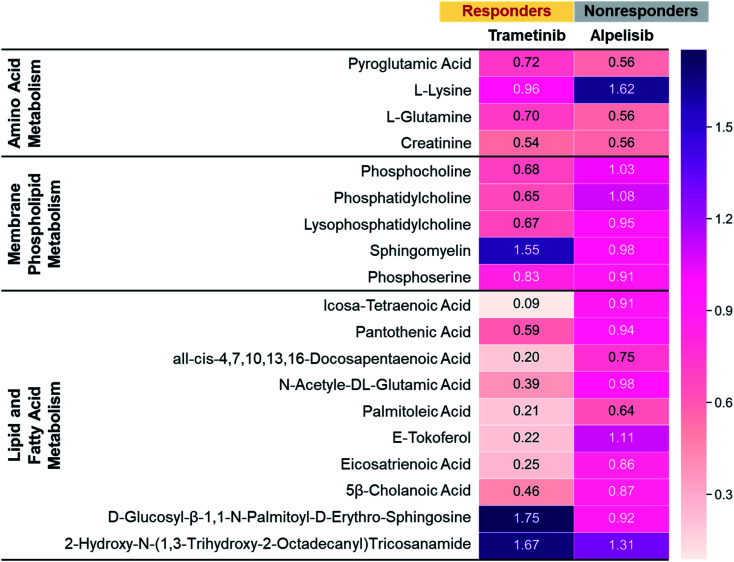
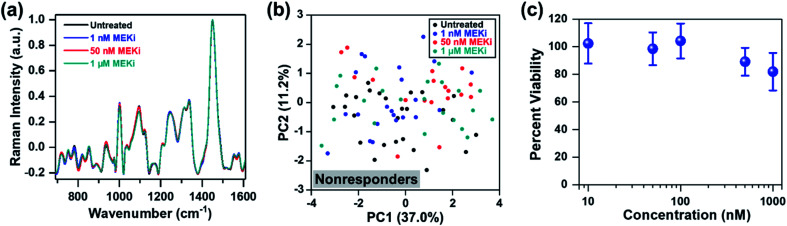
Rapid and accurate response to targeted therapies is critical to differentiate tumors that are resistant to treatment early in the regimen. In this work, we demonstrate a rapid, noninvasive, and label-free approach to evaluate treatment response to molecular inhibitors in breast cancer (BC) cells with Raman spectroscopy (RS). Metabolic reprogramming in BC was probed with RS and multivariate analysis was applied to classify the cells into responsive or nonresponsive groups as a function of drug dosage, drug type, and cell type. Metabolites identified with RS were then validated with mass spectrometry (MS). We treated triple-negative BC cells with Trametinib, an inhibitor of the extracellular-signal-regulated kinase (ERK) pathway. Changes measured with both RS and MS corresponding to membrane phospholipids, amino acids, lipids and fatty acids indicated that these BC cells were responsive to treatment. Comparatively, minimal metabolic changes were observed post-treatment with Alpelisib, an inhibitor of the mammalian target of rapamycin (mTOR) pathway, indicating treatment resistance. These findings were corroborated with cell viability assay and immunoblotting. We also showed estrogen receptor-positive MCF-7 cells were nonresponsive to Trametinib with minimal metabolic and viability changes. Our findings support that oncometabolites identified with RS will ultimately enable rapid drug screening in patients ensuring patients receive the most effective treatment at the earliest time point.
This journal is © The Royal Society of Chemistry.
Conflict of interest statement
There are no conflicts to declare.
Figures
Similar articles
-
Multi-targeted kinase inhibition alleviates mTOR inhibitor resistance in triple-negative breast cancer.Breast Cancer Res Treat. 2019 Nov;178(2):263-274. doi: 10.1007/s10549-019-05380-z. Epub 2019 Aug 6. Breast Cancer Res Treat. 2019. PMID: 31388935 Free PMC article.
-
Phosphatidylinositol-3 Kinase Inhibitors, Buparlisib and Alpelisib, Sensitize Estrogen Receptor-positive Breast Cancer Cells to Tamoxifen.Sci Rep. 2017 Aug 29;7(1):9842. doi: 10.1038/s41598-017-10555-z. Sci Rep. 2017. PMID: 28852212 Free PMC article.
-
Low-scale phosphoproteome analyses identify the mTOR effector p70 S6 kinase 1 as a specific biomarker of the dual-HER1/HER2 tyrosine kinase inhibitor lapatinib (Tykerb) in human breast carcinoma cells.Ann Oncol. 2008 Jun;19(6):1097-109. doi: 10.1093/annonc/mdm589. Epub 2008 Feb 17. Ann Oncol. 2008. PMID: 18283037
-
Estrogen Receptor-Positive Breast Cancer: Exploiting Signaling Pathways Implicated in Endocrine Resistance.Oncologist. 2018 May;23(5):528-539. doi: 10.1634/theoncologist.2017-0423. Epub 2018 Jan 19. Oncologist. 2018. PMID: 29352052 Free PMC article. Review.
-
PI3K-AKT-mTOR inhibitors in breast cancers: From tumor cell signaling to clinical trials.Pharmacol Ther. 2017 Jul;175:91-106. doi: 10.1016/j.pharmthera.2017.02.037. Epub 2017 Feb 16. Pharmacol Ther. 2017. PMID: 28216025 Review.
Cited by
-
Unveiling Cancer Metabolism through Spontaneous and Coherent Raman Spectroscopy and Stable Isotope Probing.Cancers (Basel). 2021 Apr 5;13(7):1718. doi: 10.3390/cancers13071718. Cancers (Basel). 2021. PMID: 33916413 Free PMC article. Review.
-
Quantitative Raman chemical imaging of intracellular drug-membrane aggregates and small molecule drug precipitates in cytoplasmic organelles.Adv Drug Deliv Rev. 2023 Nov;202:115107. doi: 10.1016/j.addr.2023.115107. Epub 2023 Sep 26. Adv Drug Deliv Rev. 2023. PMID: 37769851 Free PMC article. Review.
-
First Trimester Prediction of Preterm Birth in Patient Plasma with Machine-Learning-Guided Raman Spectroscopy and Metabolomics.ACS Appl Mater Interfaces. 2023 Aug 16;15(32):38185-38200. doi: 10.1021/acsami.3c04260. Epub 2023 Aug 7. ACS Appl Mater Interfaces. 2023. PMID: 37549133 Free PMC article.
-
Enzymatic Desialylation Enables Reliable Charge Variant Characterization of Highly Glycosylated and Sialylated Fc Fusion Proteins.ACS Pharmacol Transl Sci. 2025 Jan 23;8(2):394-408. doi: 10.1021/acsptsci.4c00460. eCollection 2025 Feb 14. ACS Pharmacol Transl Sci. 2025. PMID: 39974635
-
Metabolic Response to Small Molecule Therapy in Colorectal Cancer Tracked with Raman Spectroscopy and Metabolomics.Angew Chem Int Ed Engl. 2024 Oct 21;63(43):e202410919. doi: 10.1002/anie.202410919. Epub 2024 Sep 5. Angew Chem Int Ed Engl. 2024. PMID: 38995663
References
-
- Schafer J. M. Lehmann B. D. Gonzalez-Ericsson P. I. Marshall C. B. Beeler J. S. Redman L. N. Jin H. Sanchez V. Stubbs M. C. Scherle P. Johnson K. N. Sheng Q. Roland J. T. Bauer J. A. Shyr Y. Chakravarthy B. Mobley B. C. Hiebert S. W. Balko J. M. Sanders M. E. Liu P. C. C. Pietenpol J. A. Sci. Transl. Med. 2020;12:eaaw8275. doi: 10.1126/scitranslmed.aaw8275. - DOI - PMC - PubMed
Grants and funding
LinkOut - more resources
Full Text Sources
Miscellaneous