Review
. 2020 Jul 15;11(39):10553-10570.
doi: 10.1039/d0sc01721c.

Grafted semiconducting polymer amphiphiles for multimodal optical imaging and combination phototherapy

Affiliations
Review

Grafted semiconducting polymer amphiphiles for multimodal optical imaging and combination phototherapy

Chen Xie et al. Chem Sci. .

Abstract

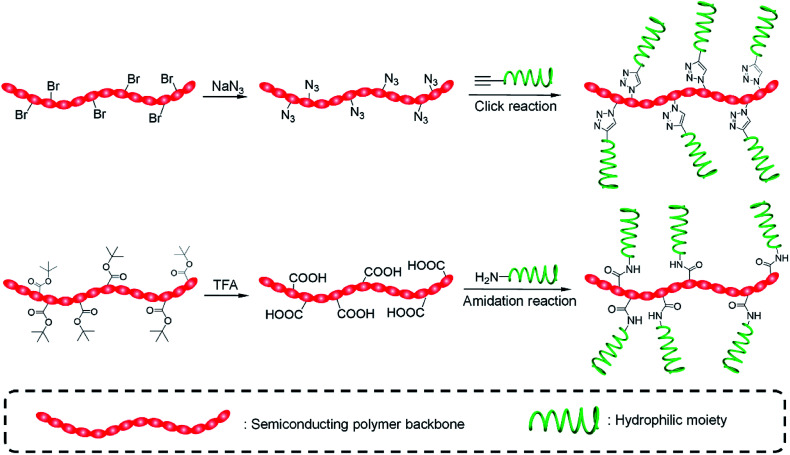
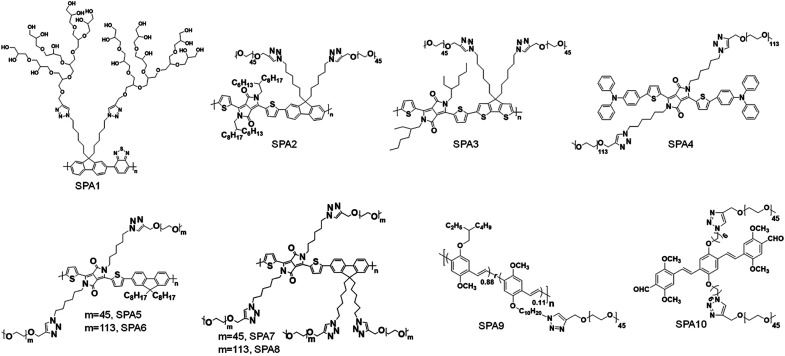
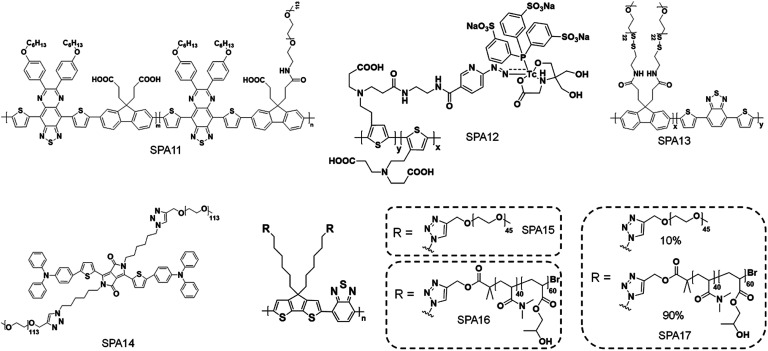
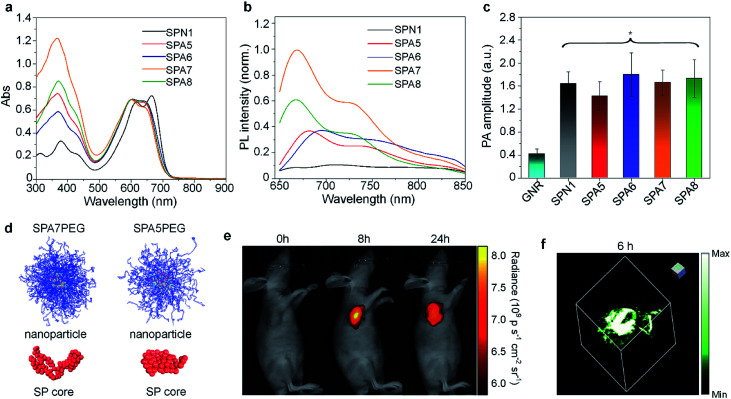
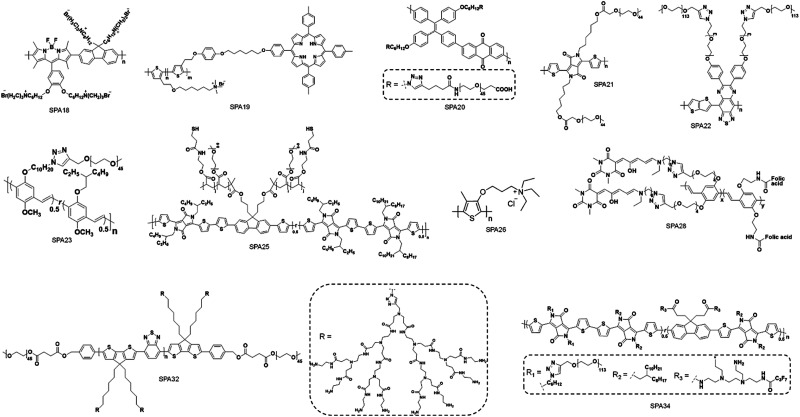
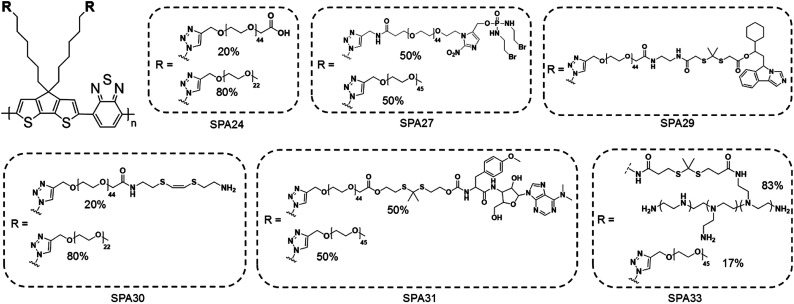
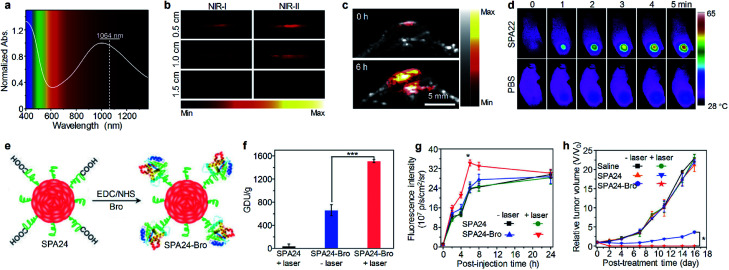
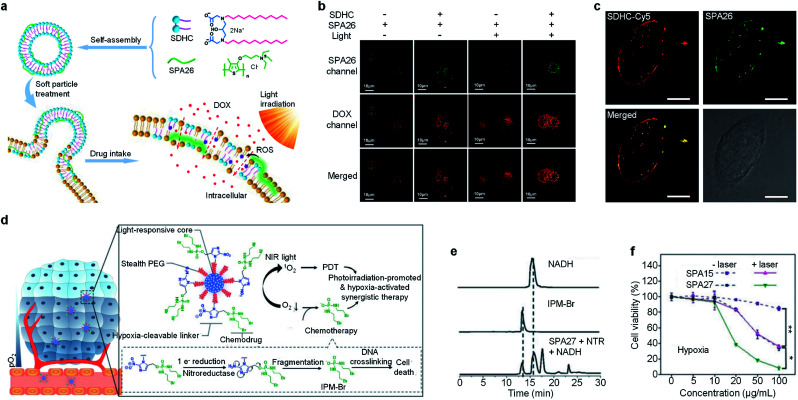
Semiconducting polymer nanoparticles (SPNs) have gained growing attention in biomedical applications. However, the preparation of SPNs is usually limited to nanoprecipitation in the presence of amphiphilic copolymers, which encounters the issue of dissociation. As an alternative to SPNs, grafted semiconducting polymer amphiphiles (SPAs) composed of a semiconducting polymer (SP) backbone and hydrophilic side chains show increased physiological stability and improved optical properties. This review summarizes recent advances in SPAs for cancer imaging and combination phototherapy. The applications of SPAs in optical imaging including fluorescence, photoacoustic, multimodal and activatable imaging are first described, followed by the discussion of applications in imaging-guided phototherapy and combination therapy, light-triggered drug delivery and gene regulation. At last, the conclusion and future prospects in this field are discussed.


Conflict of interest statement

There are no conflicts to declare.

Figures

Fig. 1
Fig. 1. Schematic illustration of SPAs prepared via click and amidation reactions.
Scheme 1
Scheme 1. Chemical structures of SPA1-10 for molecular optical imaging.
Scheme 2
Scheme 2. Chemical structures of SPA11-17 for molecular optical imaging.
Fig. 2
Fig. 2. Normalized absorption (a) and fluorescence (b) spectra of SP nanoparticles. (c) PA amplitudes of gold nanorods and SP nanoparticles under the same concentrations of optical components. (d) Simulated structures of nanoparticles and cores for SPA7PEG and SPA5PEG. (e) Representative fluorescence images of tumor bearing nude mice after i.v. injection of SPA7 at 0, 8, and 24 h. (f) Representative PA 3D image of tumor from SPA7-injected tumor bearing mice at t = 6 h post-injection. The error bars represent standard deviations of three different measurements. *No statistically significant difference. Adapted from ref. 90. Copyright© 2017 Wiley-VCH Verlag GmbH & Co. KGaA, Weinheim.
Fig. 3
Fig. 3. (a) Schematic illustration for the preparation of SPAN9. (b) Absorption spectra of SPAN9 and PPVP in 1× PBS buffer (pH 7.4). (c) Afterglow spectra of SPAN9 and PPVP under the same mass concentration (130 μg mL−1). (d) Afterglow images of living mice after i.v. injection of SPAN9 or PPVP for 40 min. (e) SBRs for fluorescence and afterglow imaging of tumor in living mice injected with SPAN9 or PPVP as a function of post-injection time. (f) Afterglow intensities of the lower quadrant region of living mice after i.v. injection of SPAN9 or PPVP as a function of post-injection time. (g) Fluorescence and afterglow images of abdominal cavity of mice after skin resection at 1.5 h post-injection of SPAN9 or PPVP. White circles mark the position of tumors. *Statistically significant difference (p < 0.05, n = 3). Error bars represent standard deviations of three different measurements (n = 3). Adapted from ref. 93. Copyright© 2018 Wiley-VCH Verlag GmbH & Co. KGaA, Weinheim.
Fig. 4
Fig. 4. (a) Schematic illustration for the preparation of SPAN11. (b) Absorption and emission spectra of SPAN11. (c) In vivo MRI and PA imaging of tumor bearing mice after i.v. injection of SPAN11 at different time points. The red circles indicate the position of tumor. (d) NIR-II fluorescence image of vascular tissues of a living mouse after i.v. injection of SPAN11 for 2 min under 808 nm laser excitation. The red arrows indicate blood vessels. (e) Representative NIR-II fluorescence images of 4T1 tumor bearing mice after i.v. injection of SPAN11 at different time points. The yellow circles indicate the position of tumor. (f) Ex vivo NIR-II fluorescence quantification of major organs from mice after 24 h post-injection of SPAN11. Error bars represent the standard deviations of three different measurements (n = 3). Adapted from ref. 96. Copyright© 2019 Ivyspring International Publisher.
Fig. 5
Fig. 5. (a) Schematic illustration of the heat-amplified PA signal of SPA17. (b) Absorption spectra of SPAs. (c) DLS of SPAs as a function of temperature in PBS (pH 7.4). (d) Thermal images of SPA15 and SPA17 at their respective maximum temperatures. (e) PA intensity of SPA17 as a function of concentration with or without 808 nm laser irradiation. (f) Schematic illustration of amplified PA imaging in the tumor site of SPA17-treated mice. (g) Representative PA images of tumor from living mice i.v. injected with SPA15 or SPA17 at 24 h post-injection with or without 808 nm laser irradiation. The error bars represent standard deviations of three separate measurements. Adapted from ref. 102. Copyright© 2019 Wiley-VCH Verlag GmbH & Co. KGaA, Weinheim.
Fig. 6
Fig. 6. Design strategies for SPA-based phototheranostics, including (i) SPAs, drug-loaded SPAs and drug-conjugated SPAs for PDT, PTT and combination therapy; (ii) prodrug-conjugated SPAs for photoactivatable drug delivery; (iii) DNA-loaded SPAs for photoactivatable gene regulation.
Scheme 3
Scheme 3. Chemical structures of SPAs for phototheranostics.
Scheme 4
Scheme 4. Chemical structures of PCPDTBT-based SPAs for phototheranostics.
Fig. 7
Fig. 7. (a) Absorption spectrum of SPA22 in aqueous solution. (b) PA images of SPA22 solution covered by chicken breast tissue of different thickness. For each depth, images were recorded under both NIR-I (820 nm) and NIR-II (1064 nm) lasers. (c) Representative NIR-II PA images of the tumor area from living mice treated with SPA22 at 0 and 6 h post-injection. (d) Infrared thermal images of mice treated with SPA22 or PBS at different laser irradiation times. (e) Schematic illustration for the synthesis of SPA24-Bro. (f) Gelatin digestion activity (in GDU) of SPA24 and SPA24-Bro with or without laser irradiation. (g) Fluorescence intensity of the tumor area as a function of post-injection time of SPA24 or SPA24-Bro. (h) Tumor growth curve of different groups. The error bars represent the standard deviations of three separate measurements (n = 3). *Statistically significant difference (p < 0.05, n = 3). ***Statistically significant difference (p < 0.001, n = 3). Adapted from ref. 110 and 113. Copyright© 2020 Elsevier and 2018 Wiley-VCH Verlag GmbH & Co. KGaA, Weinheim.
Fig. 8
Fig. 8. (a) Schematic illustration for soft particle-mediated enhanced anticancer therapy. (b) Confocal fluorescence images of DOX and SPA26 in MCF-7 cells after different treatments. (c) Confocal fluorescence images of SDHC-Cy5 and SPA26 in MCF-7 cells after incubation for 1 h. The scale bars represent 10 μm. Cell viability of A549 and HeLa cells incubated with different concentrations of SPA26. (d) Schematic illustration of SPA27 for hypoxia-activated synergistic PDT and chemotherapy. (e) HPLC profiles of NADH, IPM-Br and SPA27 incubated with NTR and NADH under anaerobic conditions for 6 h. (f) Cell viability of 4T1 cells treated with SPA15 or SPA27 at different concentrations under hypoxic conditions with or without laser irradiation. Error bars represent the standard deviations of three different measurements (n = 3). *Statistically significant difference (p < 0.05, n = 3). **Statistically significant difference (p < 0.01, n = 3). Adapted from ref. 118 and 120. Copyright© 2018 American Chemical Society and 2019 Wiley-VCH Verlag GmbH & Co. KGaA, Weinheim.
Fig. 9
Fig. 9. (a) Schematic illustration for photoactivation of SPA29 for the combination of phototherapy and checkpoint blockade immunotherapy. (b) Absorption and fluorescence spectra of SPA15 and SPA29. Black and green lines are absorption spectra and blue and red lines are fluorescence spectra. (c) HPLC profiles for NLG919 and SPA29 with or without 808 nm laser irradiation for 15 min. (d) Relative Kyn content in the cell culture medium treated with SPA15 or SPA29 with or without laser irradiation for 6 min. Error bars represent the standard deviations of three different measurements (n = 3). (e) Confocal fluorescence images of primary tumors from saline, SPA15 or SPA29-injected mice with or without laser irradiation for 6 min. Blue fluorescence shows the nucleus of cancer cells stained with DAPI. Green fluorescence is the signal of SOSG. Population of CD3+CD8+ T cells (f) and Treg cells (g) in distant tumors. Error bars represent the standard deviations of five different measurements (n = 5). ***Statistically significant difference (p < 0.001, n = 5). Adapted from ref. 128. Copyright© 2019 Wiley-VCH Verlag GmbH & Co. KGaA, Weinheim.
Fig. 10
Fig. 10. (a) Schematic illustration of SPA33-mediated delivery and photoregulation of CRISPR/Cas9 gene editing. (b) Agarose gel electrophoresis of DNA, SPA33 and DNA/SPA33 complexes at different N/P ratios. (c) Total fluorescence of GFP for SPA33/CRISPR complexes at different N/P ratios with or without 680 nm laser irradiation. (d) Confocal fluorescence images of SPA33/CRISPR-transfected cells with or without 680 nm laser irradiation. (e) Schematic illustration of laser irradiation for living mice. (f) Fluorescence images of mice at different post-irradiation times with (red circles) or without (white circles) 680 nm laser irradiation. The red/white circles indicate the regions with subcutaneously implanted Matrigel mixed HeLa cell pellets transfected with SPA33/CRISPR with/without laser irradiation. (g) Confocal fluorescence images of Matrigel mixed cell pellet slices from mice with or without laser irradiation at t = 72 h post-treatment. The blue, green and red fluorescence indicate nuclei, GFP and SPA33, respectively. Error bars represent the standard deviations of three different measurements. *No statistically significant difference. Adapted from ref. 138. Copyright© 2019 Wiley-VCH Verlag GmbH & Co. KGaA, Weinheim.

Similar articles

Cited by

References

    1. Chen H. Zhang W. Zhu G. Xie J. Chen X. Nat. Rev. Mater. 2017;2:17024. doi: 10.1038/natrevmats.2017.24. - DOI - PMC - PubMed
    1. Li C. Nat. Mater. 2014;13:110–115. doi: 10.1038/nmat3877. - DOI - PMC - PubMed
    1. Cai Y. Wei Z. Song C. Tang C. Han W. Dong X. Chem. Soc. Rev. 2019;48:22–37. doi: 10.1039/C8CS00494C. - DOI - PubMed
    1. Li J. Pu K. Chem. Soc. Rev. 2019;48:38–71. doi: 10.1039/C8CS00001H. - DOI - PubMed
    1. Jiang Y. Pu K. Acc. Chem. Res. 2018;51:1840–1849. doi: 10.1021/acs.accounts.8b00242. - DOI - PubMed