

A photocleavable peptide-tagged mass probe for chemical mapping of epidermal growth factor receptor 2 (HER2) in human cancer cells
- PMID: 34094372
- PMCID: PMC8162480
- DOI: 10.1039/d0sc04481d
A photocleavable peptide-tagged mass probe for chemical mapping of epidermal growth factor receptor 2 (HER2) in human cancer cells
Abstract
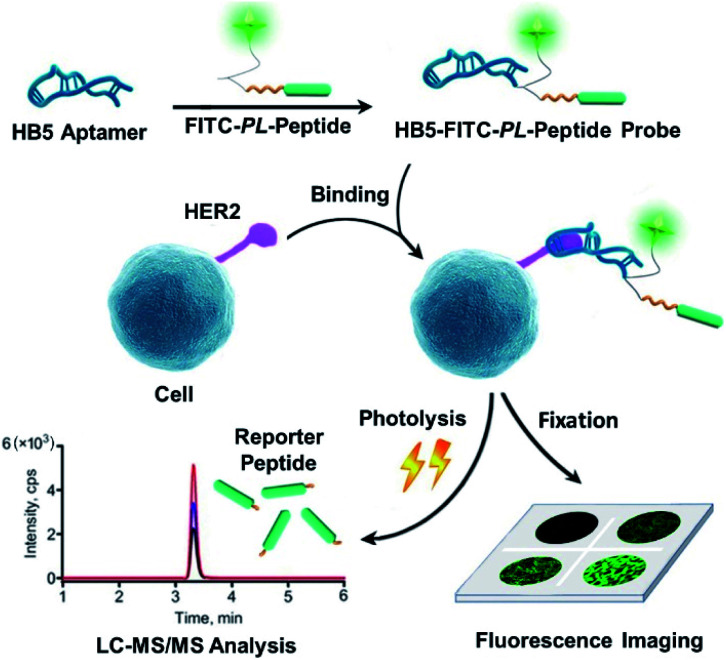
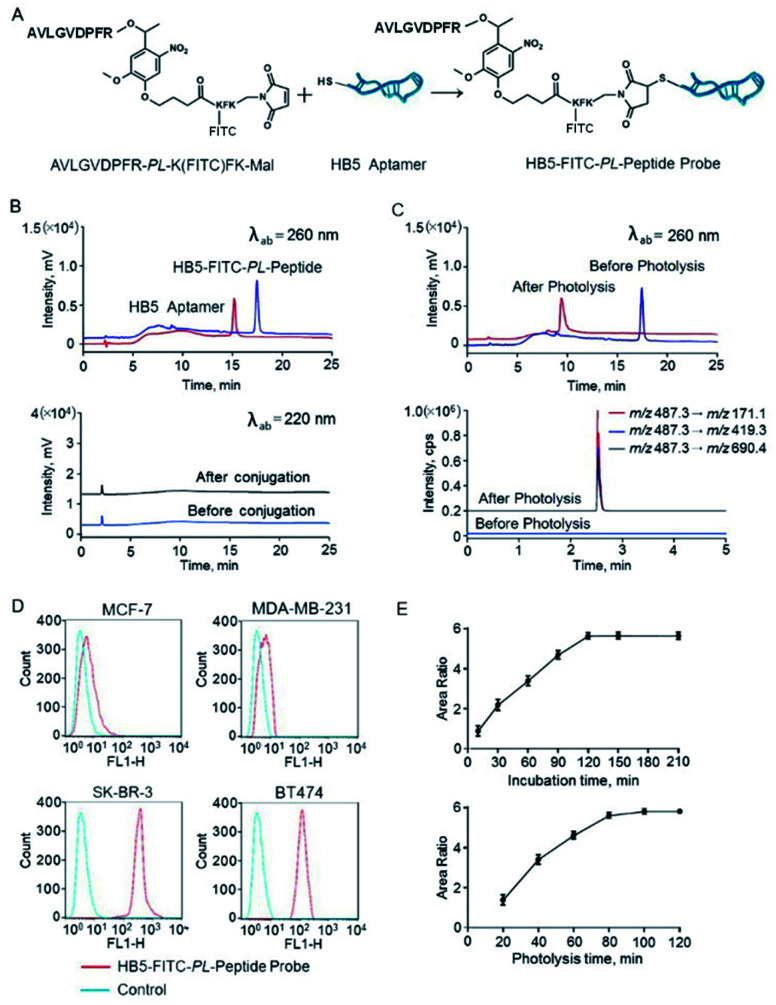
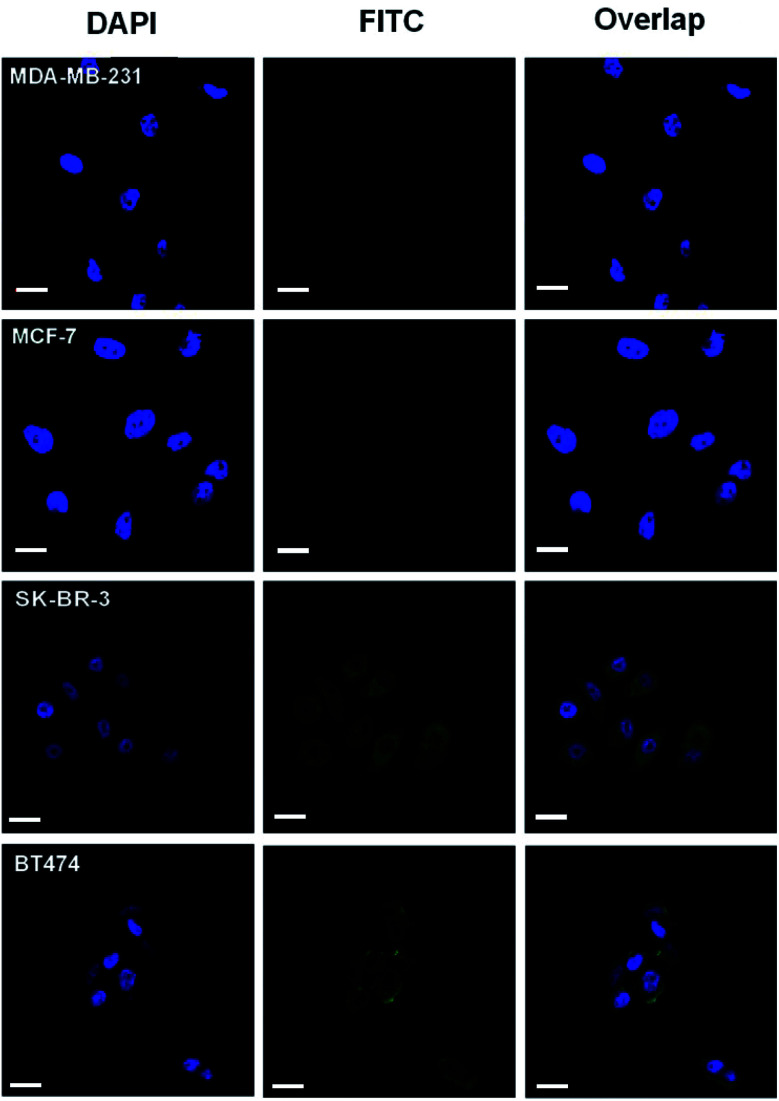
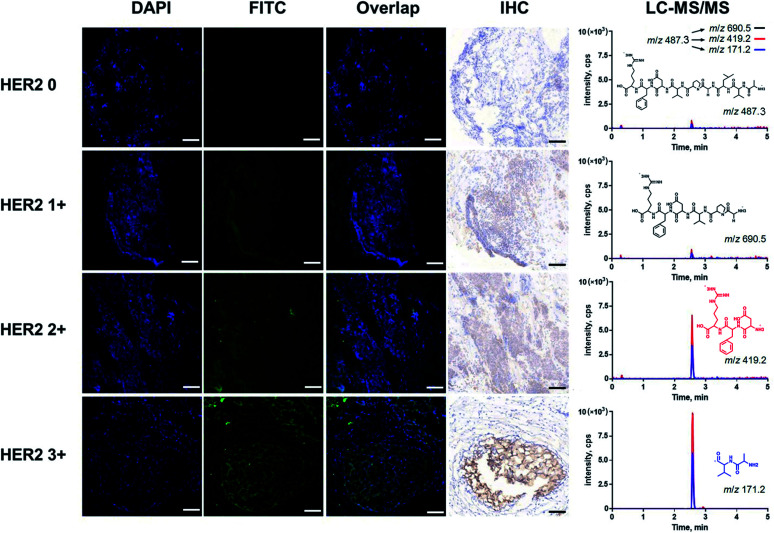
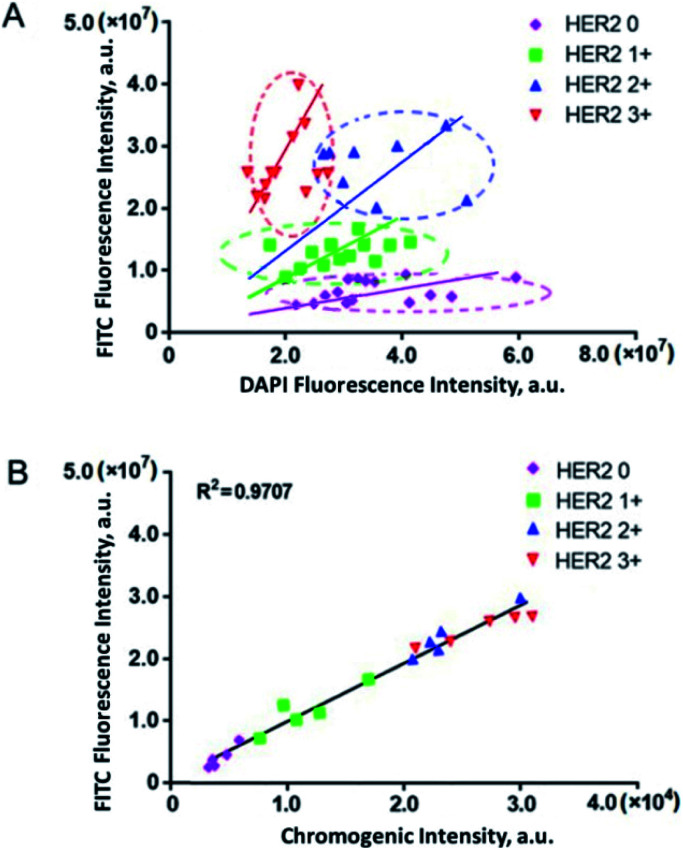
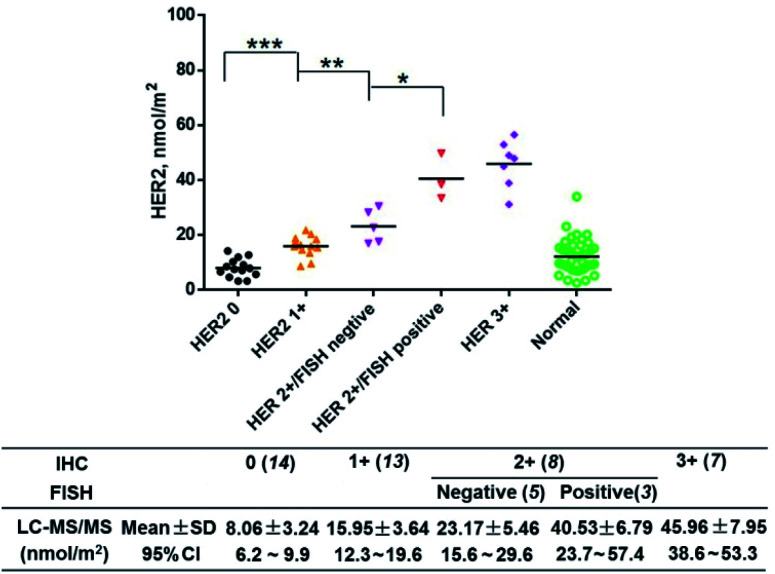
Human epidermal growth factor receptor 2 (HER2) testing has great value for cancer diagnosis, prognosis and treatment selection. However, the clinical utility of HER2 is frequently tempered by the uncertainty regarding the accuracy of the methods currently available to assess HER2. The development of novel methods for accurate HER2 testing is in great demand. Considering the visualization features of in situ imaging and the quantitative capability of mass spectrometry, integration of the two components into a molecular mapping approach has attracted increasing interest. In this work, we reported an integrated chemical mapping approach using a photocleavable peptide-tagged mass probe for HER2 detection. The probe consists of four functional domains, including the recognition unit of an aptamer to catch HER2, a fluorescent dye moiety (FITC) for fluorescence imaging, a reporter peptide for mass spectrometric quantification, and a photocleavable linker for peptide release. After characterization of this novel probe (e.g., conjugation efficiency, binding affinity and specificity, and photolysis release efficiency), the probe binding and photolysis release conditions were optimized. Then, fluorescence images were collected, and the released reporter peptide after photolysis was quantified by liquid chromatography-tandem mass spectrometry (LC-MS/MS). A limit of quantification (LOQ) of 25 pM was obtained, which very well meets the requirements for clinical laboratory testing. Finally, the developed assay was applied for HER2 testing in four breast cancer cell lines and 42 pairs of human breast primary tumors and adjacent normal tissue samples. Overall, this integrated approach based on a photocleavable peptide-tagged mass probe can provide chemical mapping including both quantitative and visual information of HER2 reliably and consistently, and may pave the way for clinical applications in a more accurate manner.
This journal is © The Royal Society of Chemistry.
Conflict of interest statement
The authors declare no competing financial interests.
Figures
Similar articles
-
Improved Detection of HER2 by a Quasi-Targeted Proteomics Approach Using Aptamer-Peptide Probe and Liquid Chromatography-Tandem Mass Spectrometry.Clin Chem. 2018 Mar;64(3):526-535. doi: 10.1373/clinchem.2017.274266. Epub 2017 Nov 15. Clin Chem. 2018. PMID: 29142051
-
A photocleavable and mass spectrometric DNA-peptide probe enables fast and specific enzyme-free detection of microRNA.Talanta. 2020 May 1;211:120726. doi: 10.1016/j.talanta.2020.120726. Epub 2020 Jan 8. Talanta. 2020. PMID: 32070590
-
An amplification strategy for detecting HER2 with a quasi-targeted proteomics approach coupled with aptamer-triggered hybridization chain reaction.Talanta. 2020 Aug 1;215:120918. doi: 10.1016/j.talanta.2020.120918. Epub 2020 Mar 13. Talanta. 2020. PMID: 32312461
-
Construction of a Mass-Tagged Oligo Probe Set for Revealing Protein Ratiometric Relationship Associated with EGFR-HER2 Heterodimerization in Living Cells.Anal Chem. 2022 Jun 28;94(25):8838-8846. doi: 10.1021/acs.analchem.1c04989. Epub 2022 Jun 16. Anal Chem. 2022. PMID: 35709389
-
[Mass spectrometry imaging technology and its application in breast cancer research].Se Pu. 2021 Jun;39(6):578-587. doi: 10.3724/SP.J.1123.2020.10005. Se Pu. 2021. PMID: 34227318 Free PMC article. Review. Chinese.
Cited by
-
Mass spectrometry-based chemical mapping and profiling toward molecular understanding of diseases in precision medicine.Chem Sci. 2021 May 25;12(23):7993-8009. doi: 10.1039/d1sc00271f. eCollection 2021 Jun 16. Chem Sci. 2021. PMID: 34257858 Free PMC article. Review.
-
Ultrasensitive detection of β-lactamase-associated drug-resistant bacteria using a novel mass-tagged probe-mediated cascaded signal amplification strategy.Chem Sci. 2022 Oct 25;13(43):12799-12807. doi: 10.1039/d2sc01530g. eCollection 2022 Nov 9. Chem Sci. 2022. PMID: 36519064 Free PMC article.
-
Simultaneous quantification of co-administered trastuzumab and pertuzumab in serum based on nano-surface and molecular-orientation limited (nSMOL) proteolysis.RSC Adv. 2024 Jun 18;14(27):19550-19559. doi: 10.1039/d4ra03060e. eCollection 2024 Jun 12. RSC Adv. 2024. PMID: 38895524 Free PMC article.
References
-
- FDA-NIH Biomarker Working Group, BEST (biomarkers, Endpoints, and other tools) Resource, Food and Drug Administration (US), Silver Spring (MD), 2016, accessed August 10, 2020, http://www.ncbi.nlm.nih.gov/books/NBK326791/ - PubMed
-
- Chen Y. Liu L. Ni R. Zhou W. Adv. Clin. Chem. 2019;91:123–162. - PubMed
LinkOut - more resources
Full Text Sources
Research Materials
Miscellaneous