. 2021;10(1):28.
doi: 10.1140/epjds/s13688-021-00278-7. Epub 2021 May 30.

Urban green space and happiness in developed countries

Affiliations

Urban green space and happiness in developed countries

Oh-Hyun Kwon et al. EPJ Data Sci. 2021.

Abstract

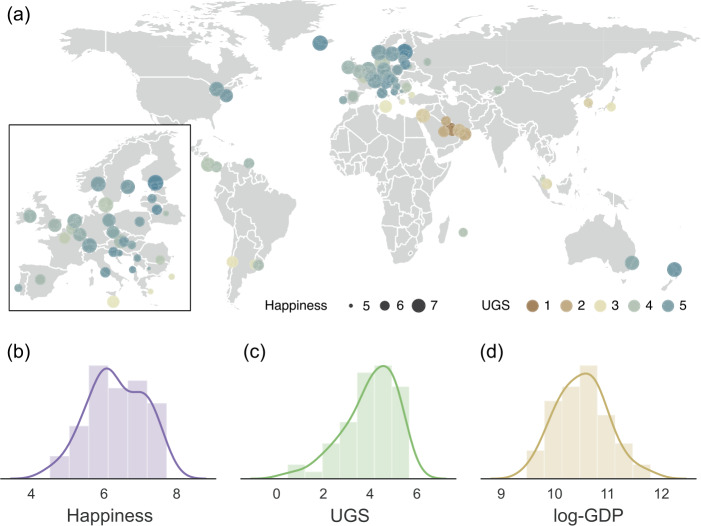
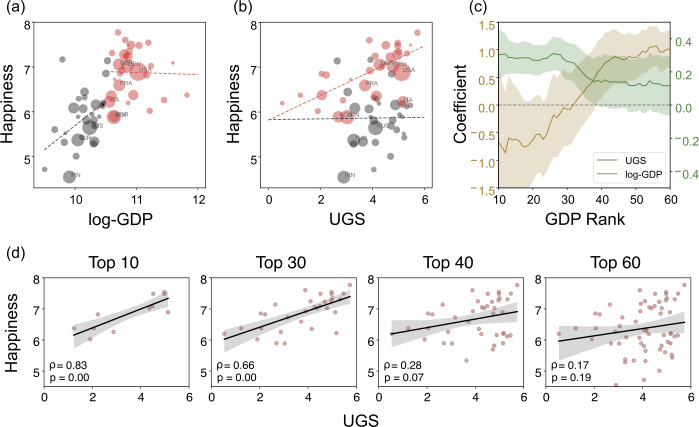
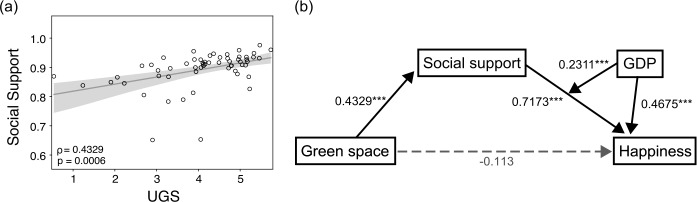
Urban green space is thought to contribute to citizen happiness by promoting physical and mental health. Nevertheless, how urban green space and happiness are related across many countries with different socioeconomic conditions has not been explored. By measuring the urban green space score (UGS) from high-resolution satellite imagery of 90 global cities covering 179,168 km2 and 230 million people in 60 developed countries, we find that the amount of urban green space and GDP are correlated with a nation's happiness level. More specifically, urban green space and GDP are each individually associated with happiness. Yet, only urban green space is related to happiness in the 30 wealthiest countries, whereas GDP alone can explain happiness in the subsequent 30 countries in terms of wealth. We further show that the relationship between urban green space and happiness is mediated by social support and that GDP moderates this relationship. These findings corroborate the importance of maintaining urban green space as a place for social cohesion to support people's happiness.

Supplementary information: The online version contains supplementary material available at 10.1140/epjds/s13688-021-00278-7.

Keywords: GIS; Happiness; Satellite imagery; Urban green space.


Conflict of interest statement

Competing interestsThe authors declare that they have no competing interests.

Figures

Figure 1
Figure 1
The distributions of urban green space and happiness over the world. (a) The map of urban green space and happiness in 60 developed countries. The size and color of circles represent the level of happiness and urban green space in a country, respectively. The markers are placed on the most populated cities of each country. (b)–(d) The histograms of (b) happiness, (c) urban green space (UGS) and (d) logarithmic GDP per capita (log-GDP). We use the logarithm of the total NDVI per capita as an indicator of urban green space, and the logarithm of GDP per capita as a measure of wealth
Figure 2
Figure 2
The effect of GDP on the green-happiness relation. (a), (b) The relations of (a) log-GDP and happiness, and (b) urban green space (i.e., UGS) and happiness across 60 developed countries. The top 30 and the lower 30 countries ranked by GDP are sized by the population size and colored by red and black. The dotted lines are the linear fit for each GDP group. (c) Changes of coefficients between urban green space and happiness for different sets of GDP rank with increasing window size from top 10 to 60. (d) The rank correlations between the UGS and happiness for the groups of increasing countries in the GDP rank order
Figure 3
Figure 3
The moderated mediation model for the UGS, happiness and socioeconomic indicators. (a) Scatter plot of social support and the UGS across countries. (b) Diagram for the moderated mediation model. The boxes denote the model variables. Solid black arrows denote a statistically significant relationship between a pair of variables with the regression coefficient and the p-value (i.e., ∗∗∗p<0.01). The gray dashed arrow represents a non-significant relationship. Note that the coefficients are calculated with z-scores of the variables to compare the effect size directly
Figure 4
Figure 4
Measuring urban green spaces. (a) Measurement methods to compute the size of urban green space in each country. First, we find cities occupying more than 10 percent of the total population in a country. Then, we extract the built-up area of the cities with Copernicus global landcover data. Finally, we calculate vegetation indices (e.g., NDVI) within the area using Sentinel-2 satellite images. (b) Urban green space measured by the UGS (upper row) and the vegetation ratio (lower row) in four world cities. The red areas in the upper row indicate vegetation for the NDVI threshold of 0.4. The lower row images show the adjusted NDVI per capita (i.e., UGS) for every 10m by 10m pixel

References

    1. de Vries S, Verheij RA, Groenewegen PP, Spreeuwenberg P. Natural environments—healthy environments? An exploratory analysis of the relationship between greenspace and health. Environ Plann A Econ Space. 2003;35(10):1717–1731. doi: 10.1068/a35111. - DOI
    1. Gascon M, Triguero-Mas M, Martínez D, Dadvand P, Forns J, Plasència A, Nieuwenhuijsen MJ. Mental health benefits of long-term exposure to residential green and blue spaces: a systematic review. Int J Environ Res Public Health. 2015;12(4):4354–4379. doi: 10.3390/ijerph120404354. - DOI - PMC - PubMed
    1. Dadvand P, Bartoll X, Basagaña X, Dalmau-Bueno A, Martinez D, Ambros A, Cirach M, Triguero-Mas M, Gascon M, Borrell C, Nieuwenhuijsen MJ. Green spaces and general health: roles of mental health status, social support and physical activity. Environ Int. 2016;91:161–167. doi: 10.1016/j.envint.2016.02.029. - DOI - PubMed
    1. UN (2015) Sustainable Development Goals. https://sdgs.un.org/goals. Accessed 4 November 2020
    1. MacKerron G, Mourato S. Happiness is greater in natural environments. Glob Environ Change. 2013;23:992–1000. doi: 10.1016/j.gloenvcha.2013.03.010. - DOI

LinkOut - more resources