

Big data insight on global mobility during the Covid-19 pandemic lockdown
- PMID: 34094812
- PMCID: PMC8170440
- DOI: 10.1186/s40537-021-00474-2
Big data insight on global mobility during the Covid-19 pandemic lockdown
Abstract
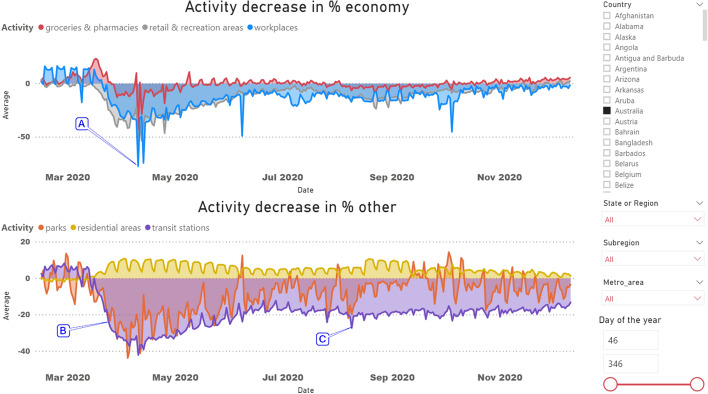
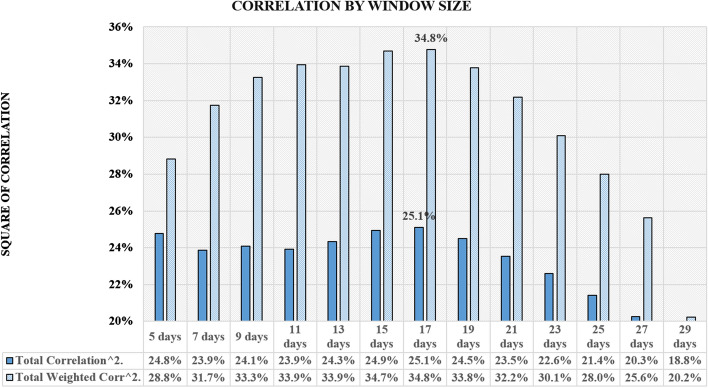
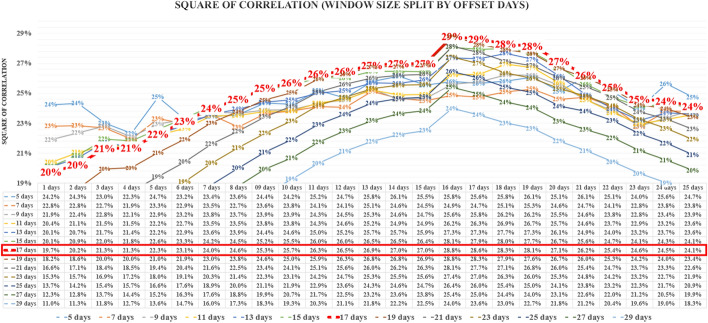
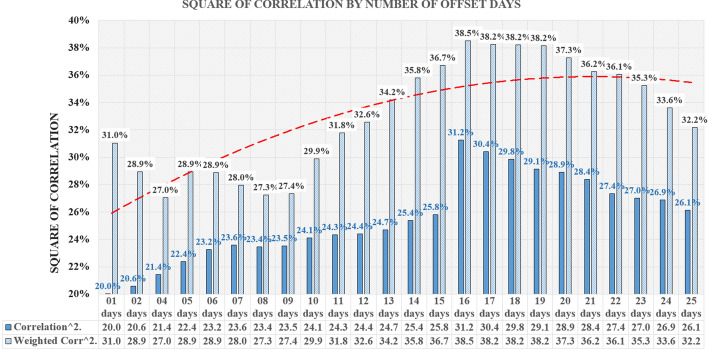
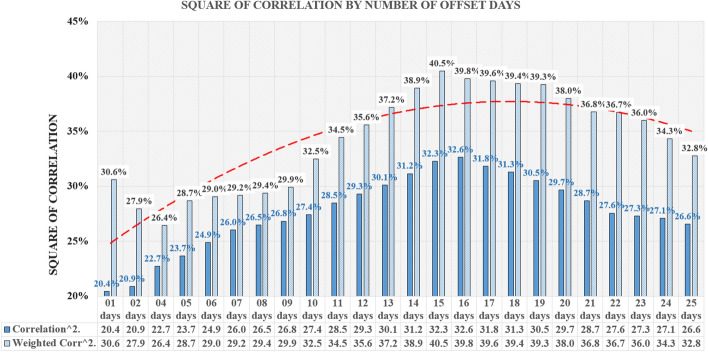
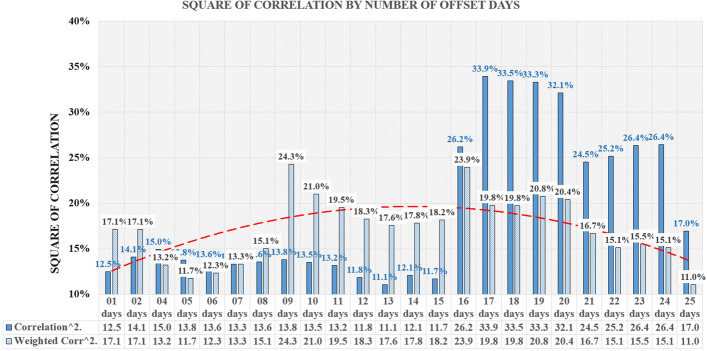
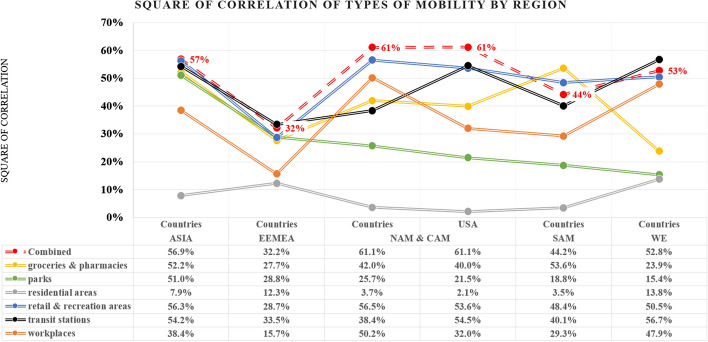
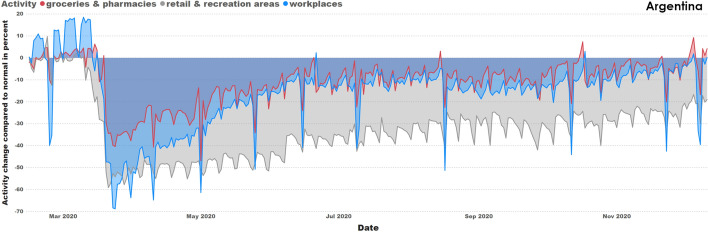
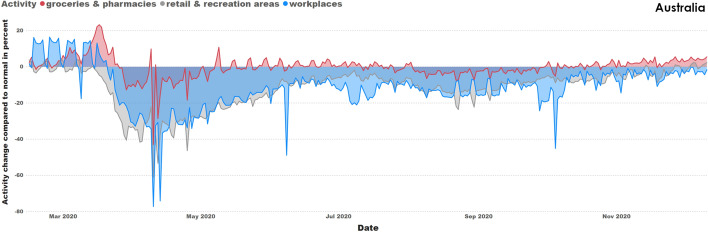
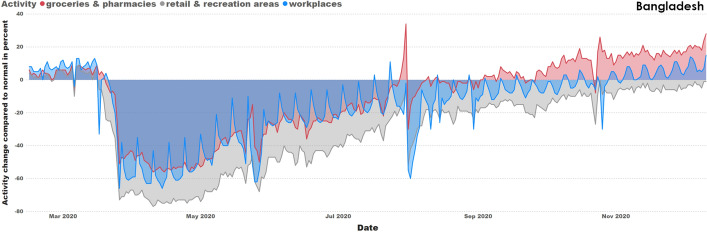
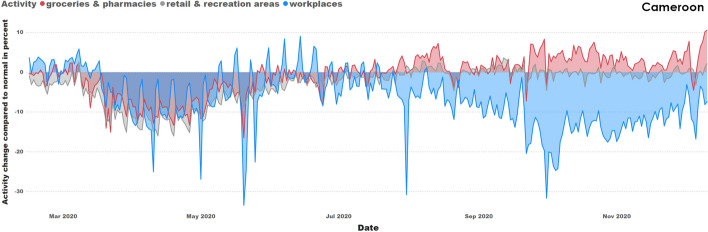
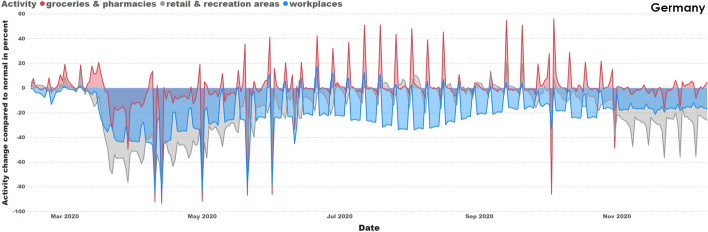
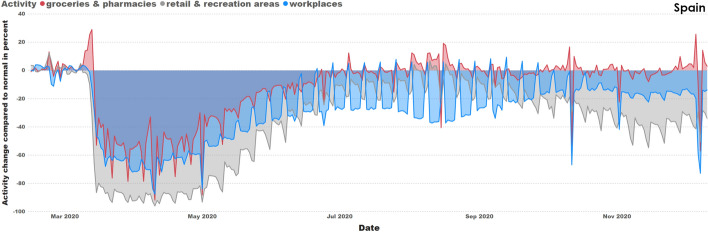
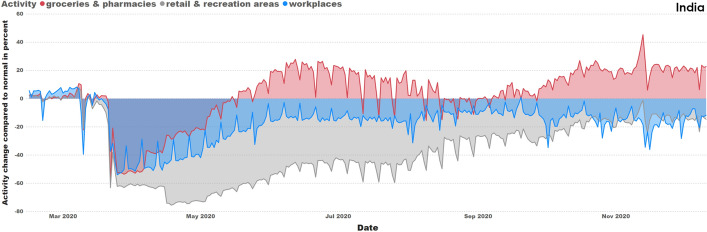
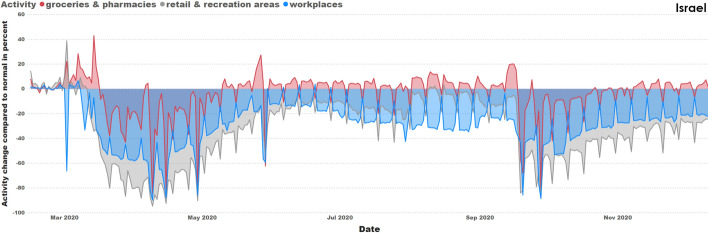
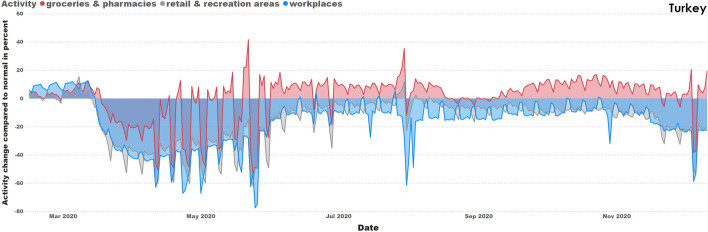
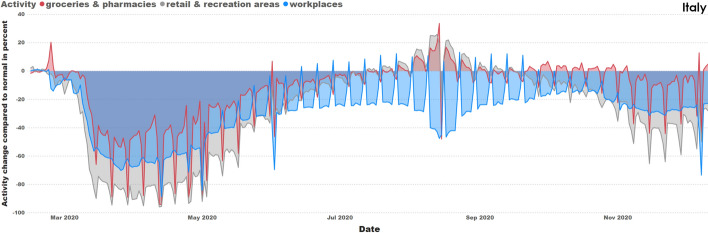
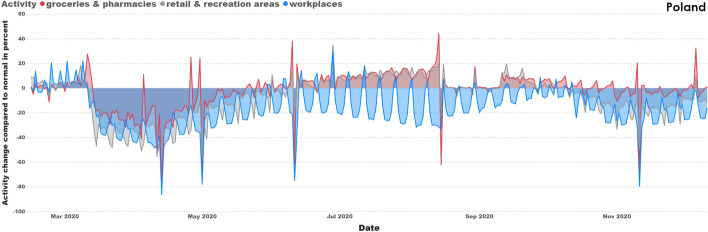
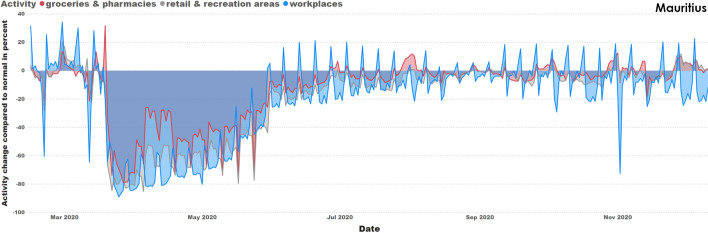
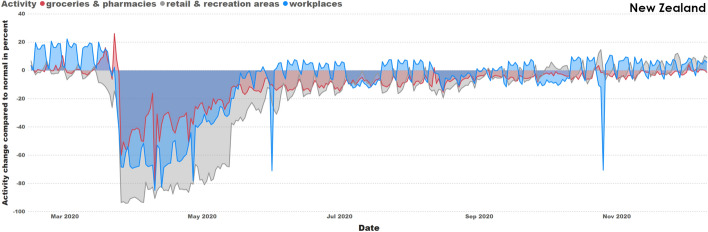
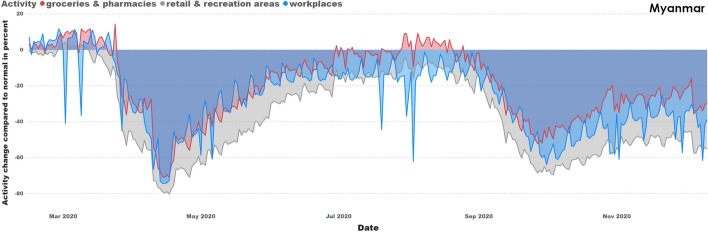
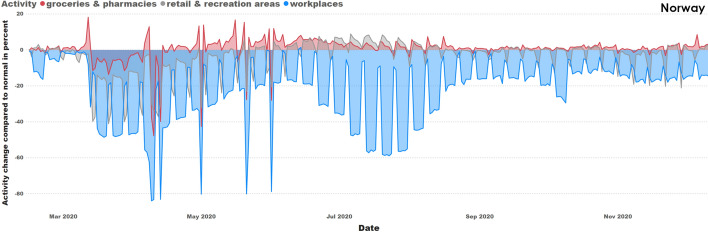
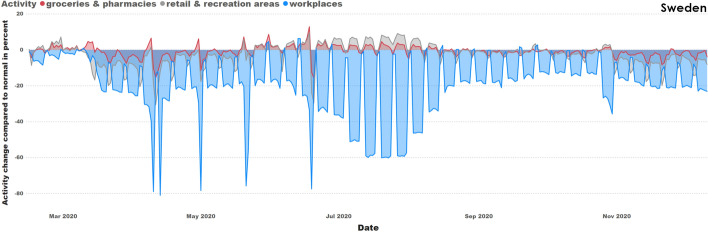
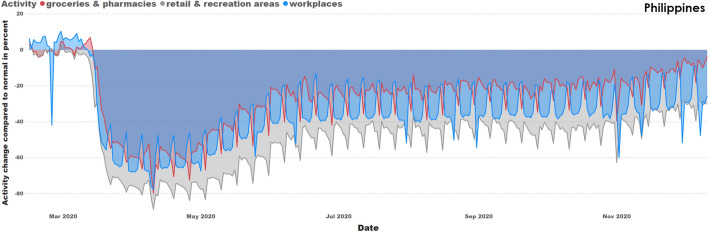
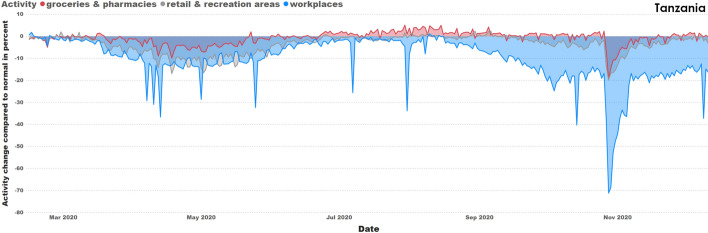
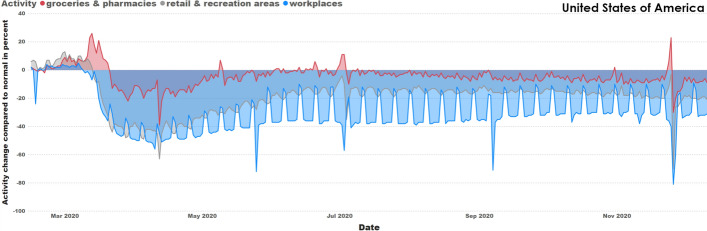
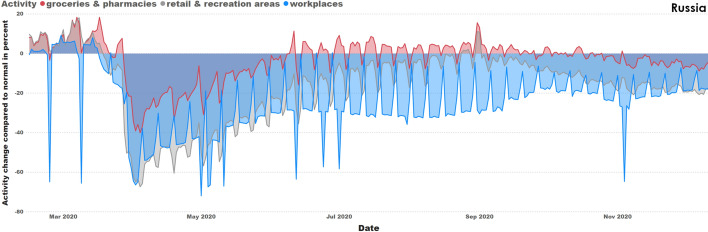
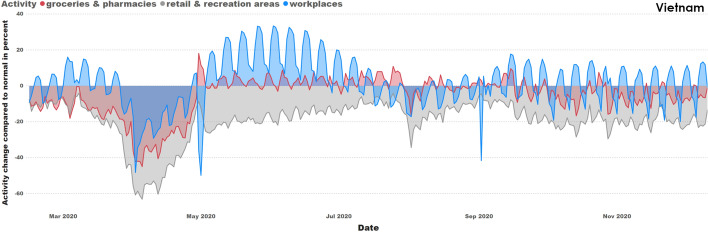
The Covid-19 pandemic that began in the city of Wuhan in China has caused a huge number of deaths worldwide. Countries have introduced spatial restrictions on movement and social distancing in response to the rapid rate of SARS-Cov-2 transmission among its populations. Research originality lies in the taken global perspective revealing indication of significant relationships between changes in mobility and the number of Covid-19 cases. The study uncovers a time offset between the two applied databases, Google Mobility and John Hopkins University, influencing correlations between mobility and pandemic development. Analyses reveals a link between the introduction of lockdown and the number of new Covid-19 cases. Types of mobility with the most significant impact on the development of the pandemic are "retail and recreation areas", "transit stations", "workplaces" "groceries and pharmacies". The difference in the correlation between the lockdown introduced and the number of SARS-COV-2 cases is 81%, when using a 14-day weighted average compared to the 7-day average. Moreover, the study reveals a strong geographical diversity in human mobility and its impact on the number of new Covid-19 cases.
Keywords: Big data; Correlation; Covid-19; Human dynamics; Human mobility; Lockdown.
© The Author(s) 2021.
Conflict of interest statement
Competing interestsThe authors declare that they have no competing interests.
Figures
Similar articles
-
Associations between changes in population mobility in response to the COVID-19 pandemic and socioeconomic factors at the city level in China and country level worldwide: a retrospective, observational study.Lancet Digit Health. 2021 Jun;3(6):e349-e359. doi: 10.1016/S2589-7500(21)00059-5. Lancet Digit Health. 2021. PMID: 34045001 Free PMC article.
-
Lockdown for COVID-19 and its impact on community mobility in India: An analysis of the COVID-19 Community Mobility Reports, 2020.Child Youth Serv Rev. 2020 Sep;116:105160. doi: 10.1016/j.childyouth.2020.105160. Epub 2020 Jun 12. Child Youth Serv Rev. 2020. PMID: 32834269 Free PMC article.
-
Associations between COVID-19 Pandemic, Lockdown Measures and Human Mobility: Longitudinal Evidence from 86 Countries.Int J Environ Res Public Health. 2022 Jun 14;19(12):7317. doi: 10.3390/ijerph19127317. Int J Environ Res Public Health. 2022. PMID: 35742567 Free PMC article.
-
The effect of different COVID-19 public health restrictions on mobility: A systematic review.PLoS One. 2021 Dec 8;16(12):e0260919. doi: 10.1371/journal.pone.0260919. eCollection 2021. PLoS One. 2021. PMID: 34879083 Free PMC article.
-
Lessons from SARS-CoV-2 Pandemic: Evolution, Disease Dynamics and Future.Biology (Basel). 2020 Jun 26;9(6):141. doi: 10.3390/biology9060141. Biology (Basel). 2020. PMID: 32604825 Free PMC article. Review.
Cited by
-
Air pollution and mobility patterns in two Ugandan cities during COVID-19 mobility restrictions suggest the validity of air quality data as a measure for human mobility.Environ Sci Pollut Res Int. 2023 Mar;30(12):34856-34871. doi: 10.1007/s11356-022-24605-1. Epub 2022 Dec 15. Environ Sci Pollut Res Int. 2023. PMID: 36520281 Free PMC article.
-
The Relationship between Prevention and Panic from COVID-19, Ethical Principles, Life Expectancy, Anxiety, Depression and Stress.Int J Environ Res Public Health. 2022 May 11;19(10):5841. doi: 10.3390/ijerph19105841. Int J Environ Res Public Health. 2022. PMID: 35627379 Free PMC article.
-
Analysis of COVID-19 outbreak in Hubei province based on Tencent's location big data.Front Public Health. 2023 May 26;11:1029385. doi: 10.3389/fpubh.2023.1029385. eCollection 2023. Front Public Health. 2023. PMID: 37304123 Free PMC article.
-
Nonlinear time series analysis of state-wise COVID-19 in Malaysia using wavelet and persistent homology.Sci Rep. 2024 Nov 11;14(1):27562. doi: 10.1038/s41598-024-79002-0. Sci Rep. 2024. PMID: 39528569 Free PMC article.
-
Human behaviour, NPI and mobility reduction effects on COVID-19 transmission in different countries of the world.BMC Public Health. 2022 Aug 22;22(1):1594. doi: 10.1186/s12889-022-13921-3. BMC Public Health. 2022. PMID: 35996132 Free PMC article.
References
-
- Liu H, Fang C, Gao Q. Evaluating the real-time impact of COVID-19 on cities: China as a case study. CompLex. 2020;11:1–11.
-
- Mirri S, Roccetti M, Delnevo G. The new york city covid-19 spread in the 2020 spring: a study on the potential role of particulate using time series analysis and machine learning. Appl Sci. 2021;11(3):1177. doi: 10.3390/app11031177. - DOI
LinkOut - more resources
Full Text Sources
Miscellaneous