. 2021 May 19:23:100265.
doi: 10.1016/j.pacs.2021.100265. eCollection 2021 Sep.

Photoacoustic characteristics of carbon-based infrared absorbers

Affiliations

Photoacoustic characteristics of carbon-based infrared absorbers

Jussi Rossi et al. Photoacoustics. .

Abstract

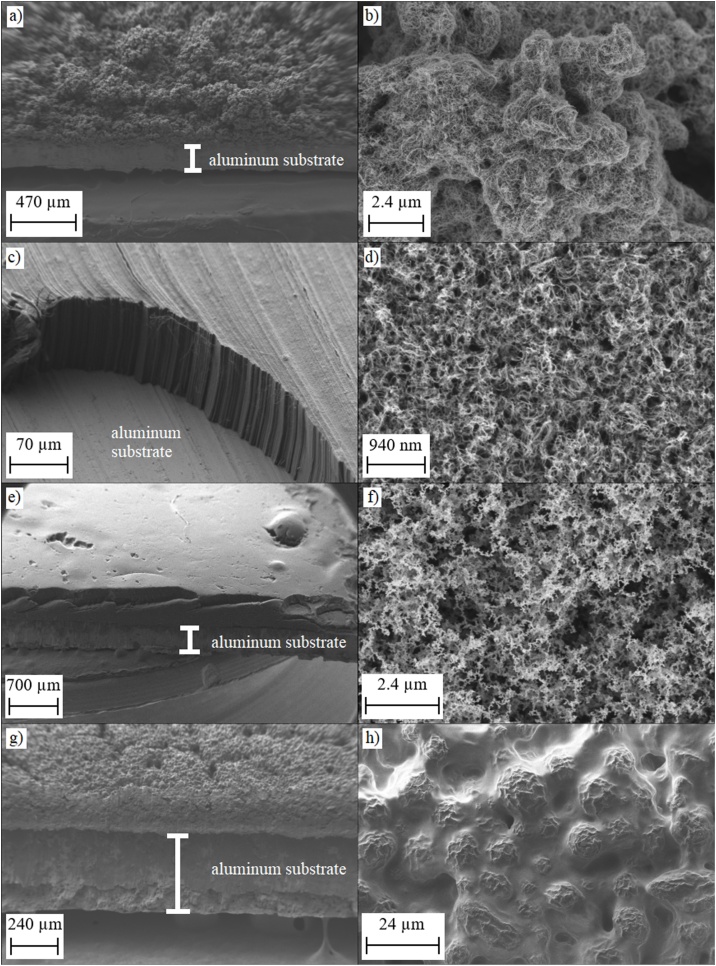
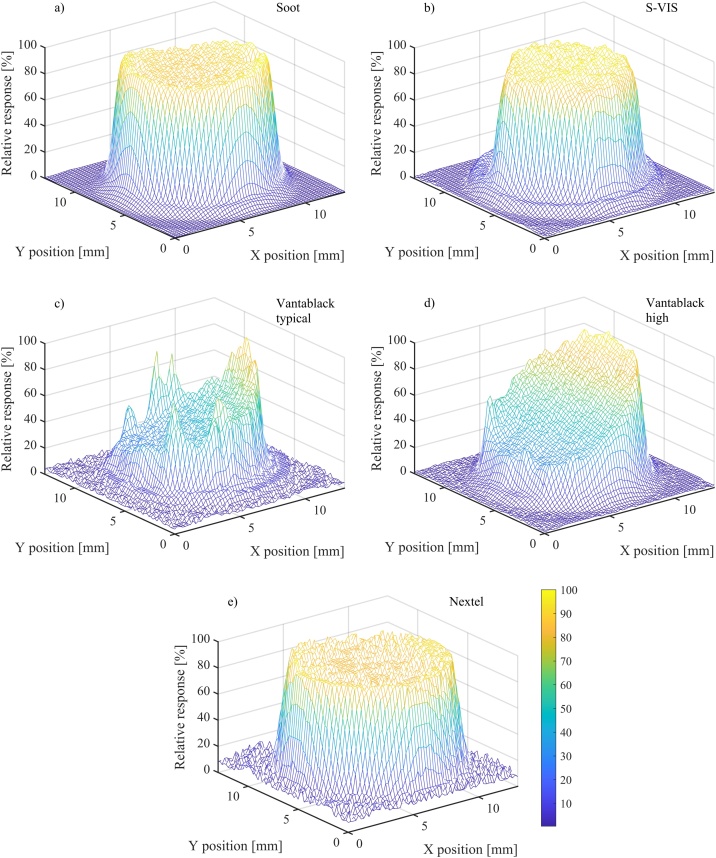
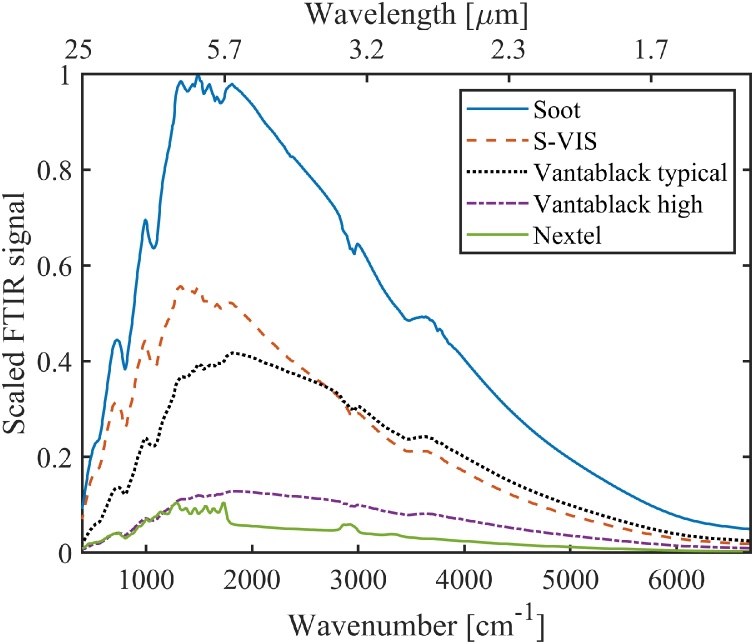
We present an experimental comparison of photoacoustic responsivities of common highly absorbing carbon-based materials. The comparison was carried out with parameters relevant for photoacoustic power detectors and Fourier-transform infrared (FTIR) spectroscopy: we covered a broad wavelength range from the visible red to far infrared (633 nm to 25 μm) and the regime of low acoustic frequencies (< 1 kHz). The investigated materials include a candle soot-based coating, a black paint coating and two different carbon nanotube coatings. Of these, the low-cost soot absorber produced clearly the highest photoacoustic response over the entire measurement range.

Keywords: Candle soot; Carbon nanotubes; Photoacoustic response.


Conflict of interest statement

The authors declare that they have no known competing financial interests or personal relationships that could have appeared to influence the work reported in this paper.

Figures

Fig. 1
Fig. 1
Side view (left row) and top view (right row) SEM pictures of the cut samples. a) – b) S-VIS, c) – d) Vantablack, e) – f) candle soot and g) – h) Nextel-coating.
Fig. 2
Fig. 2
a) Sooting process, where a sample cup is held in the tip of a candle flame. b) A sample cup and holder of the PA301 photoacoustic detector.
Fig. 3
Fig. 3
Simplified schematic of the photoacoustic laser power measurement setup (not all mirrors are shown). The chopped laser beam is aligned to the photoacoustic cell and the acoustic signal is recorded with the cantilever microphone by highly sensitive interferometric readout and processed with a Digital signal processor (DSP). The laser power level is adjusted with a neutral density filter (ND). The right-hand side of the figure shows an example of a PA spectrum, measured with 40 Hz chopping frequency, 6.26 s Fourier time constant and with an optical power of 50 nW (at 633 nm wavelength).
Fig. 4
Fig. 4
a) Photoacoustic response curves recorded with a 9.2 μm laser, candle-soot absorber and with two different carrier gases, He and N2. The arrow indicates the wavenumber range covered in the complementary FTIR measurements (see next section and the Appendix). b) The ratio of these two curves in the frequency range of 10 to 700 Hz.
Fig. 5
Fig. 5
a) The photoacoustic signals of different absorbers normalized to 1 mW of optical power. b) The same spectral responsivities divided by that of the candle soot absorber, as measured with monochromatic lasers at six different wavelengths. The lines between the measured points are guides to the eye and do not present any physically meaningful fitting function. The chopping frequency was 40 Hz, and the acoustic carrier gas was helium.
Fig. 6
Fig. 6
Spatial uniformity of PA response for different absorbers. The laser wavelength and the probe laser spot size were 633 nm and 1.2 mm, respectively.
Fig. 7
Fig. 7
The principle of photoacoustic characterization of different absorbers using an FTIR spectrometer. Inside the FTIR, a broadband light emitted by the IR source (SiC) is modulated by the movable mirror of the interferometer. The collimated output is focused into the photoacoustic cell and the acoustic signal is recorded with the cantilever microphone by highly sensitive interferometric readout. Fourier transform (FT) of the interferogram gives the photoacoustic spectrum.
Fig. 8
Fig. 8
Photoacoustic FTIR spectra of different absorbers. All spectra are scaled by dividing them with the maximum signal of the soot sample. The spectral shape is mostly due to the SiC light source, whose emission spectrum closely follows Planck’s law. The long-wavelength side of the spectrum is attenuated due to the increased losses of the FTIR’s KBr beamsplitter at > 20 μm. The dips in the spectra are caused by absorbing molecules in the light path (mostly water vapor in the laboratory air). The spectral resolution of the FTIR instrument was set to 15 cm−1, and the acoustic carrier gas used in the measurements was helium. For Vantablack, two curves are shown to exemplify the significant sample-to-sample variation, see text for details.
Fig. 9
Fig. 9
Photoacoustic signals of different absorbers divided by that of the candle soot absorber, as calculated from the PA FTIR spectra of Fig. 8. The shaded areas around the curves describe the statistical uncertainties of the FTIR measurements. Reference measurements done with lasers are indicated by dots and their statistical uncertainties by error bars.
Fig. 10
Fig. 10
The ratios of photoacoustic FTIR signals measured with two different acoustic carrier gases, He and N2.
Fig. A1
Fig. A1
The photoacoustic response curves recorded with a 14.85 μm laser for all the absorbers in a). In b) ratios with respect to soot are presented. Carrier gas helium and modulation frequency range of 40 Hz to 650 Hz.
Fig. A2
Fig. A2
Photoacoustic FTIR spectra recorded with different absorbers. These data were used to calculate the average FTIR spectra and statistical uncertainties in Fig. 8, Fig. 9 of the main text. Carrier gas was helium.

References

    1. Volkov D.S., Rogova O.B., Proskurnin M.A. Photoacoustic and photothermal methods in spectroscopy and characterization of soils and soil organic matter. Photoacoustics. 2020;17:100151. - PMC - PubMed
    1. Giglio M., Zifarelli A., Sampaolo A., Menduni G., Elefante A., Blanchard R. Broadband detection of methane and nitrous oxide using a distributed-feedback quantum cascade laser array and quartz-enhanced photoacoustic sensing. Photoacoustics. 2020;17:100159. - PMC - PubMed
    1. Tomberg T., Vainio M., Hieta T., Halonen L. Sub-parts-per-trillion level sensitivity in trace gas detection by cantilever-enhanced photo-acoustic spectroscopy. Sci. Rep. 2018;8:1–7. - PMC - PubMed
    1. Laurila T., Cattaneo H., Koskinen V., Kauppinen J., Hernberg R. Diode laser-based photoacoustic spectroscopy with interferometrically-enhanced cantilever detection. Opt. Express. 2005;13:2453–2458. - PubMed
    1. Zhao T., Desjardins A.E., Ourselin S., Vercauteren T., Xia W. Minimally invasive photoacoustic imaging: current status and future perspectives. Photoacoustics. 2019;16:100146. - PMC - PubMed

LinkOut - more resources