. 2021 May 18:11:637971.
doi: 10.3389/fonc.2021.637971. eCollection 2021.

Development of an Aerobic Glycolysis Index for Predicting the Sorafenib Sensitivity and Prognosis of Hepatocellular Carcinoma

Affiliations

Development of an Aerobic Glycolysis Index for Predicting the Sorafenib Sensitivity and Prognosis of Hepatocellular Carcinoma

Yu Pan et al. Front Oncol. .

Abstract

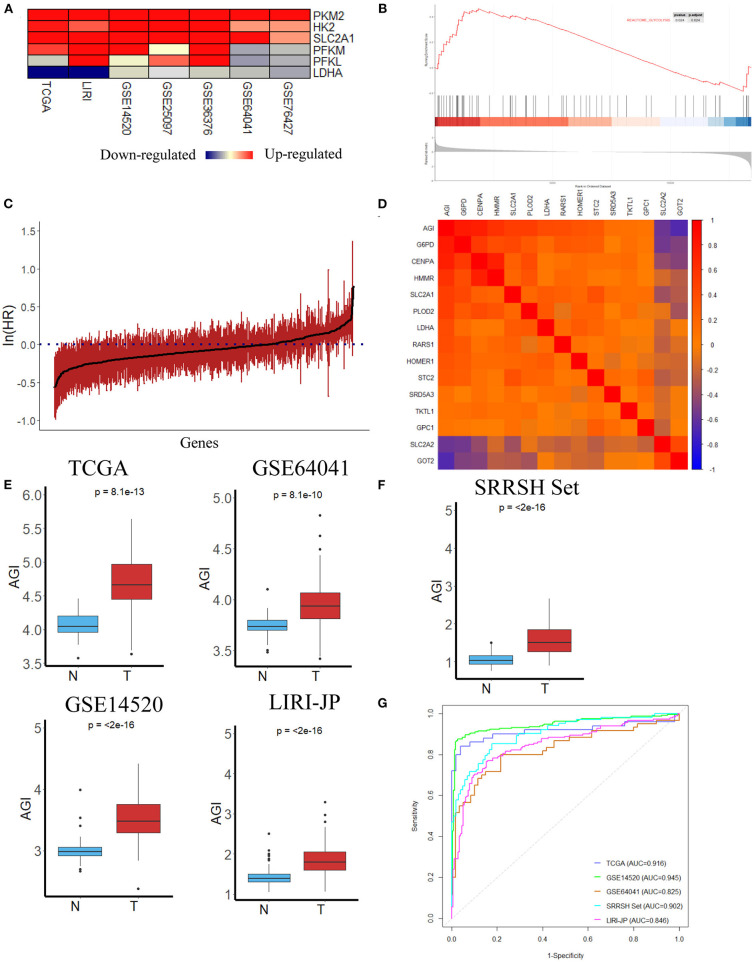
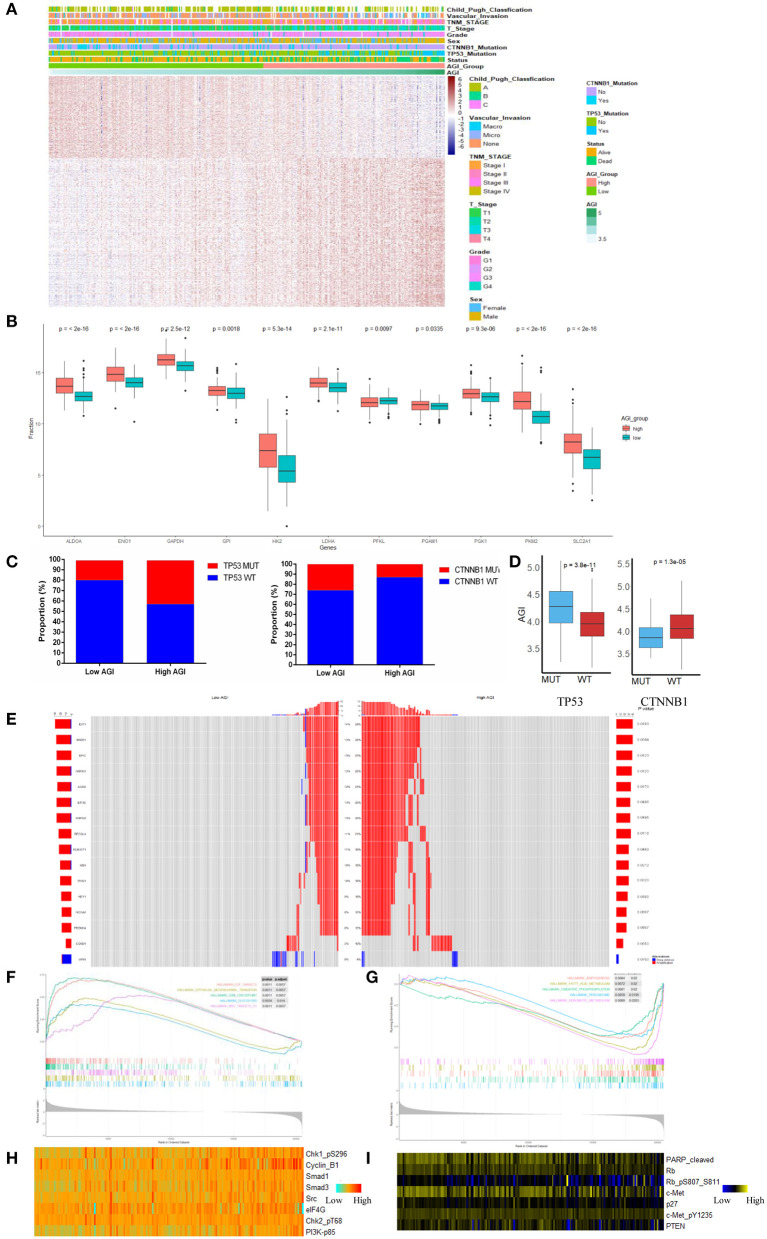
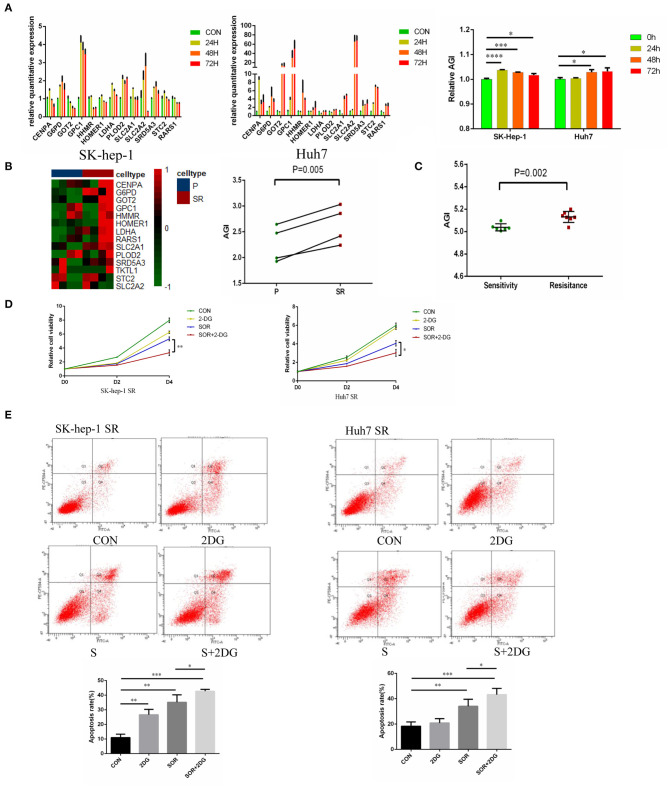
Hepatocellular carcinoma (HCC) is a deadly tumor with high heterogeneity. Aerobic glycolysis is a common indicator of tumor growth and plays a key role in tumorigenesis. Heterogeneity in distinct metabolic pathways can be used to stratify HCC into clinically relevant subgroups, but these have not yet been well-established. In this study, we constructed a model called aerobic glycolysis index (AGI) as a marker of aerobic glycolysis using genomic data of hepatocellular carcinoma from The Cancer Genome Atlas (TCGA) project. Our results showed that this parameter inferred enhanced aerobic glycolysis activity in tumor tissues. Furthermore, high AGI is associated with poor tumor differentiation and advanced stages and could predict poor prognosis including reduced overall survival and disease-free survival. More importantly, the AGI could accurately predict tumor sensitivity to Sorafenib therapy. Therefore, the AGI may be a promising biomarker that can accurately stratify patients and improve their treatment efficacy.

Keywords: Sorafenib; aerobic glycolysis; biomarker; hepatocellar carcinoma; prognosis.


Conflict of interest statement

The authors declare that the research was conducted in the absence of any commercial or financial relationships that could be construed as a potential conflict of interest.

Figures

Figure 1
Figure 1
Flowchart presenting the establishment and validation of the gene signature.
Figure 2
Figure 2
Construction of the aerobic glycolysis index (AGI) model and validation of the AGI in tumor and normal tissues. (A) Heatmap of glycolysis-related gene expression in different datasets. (B) Gene Set Enrichment Analysis (GSEA) of the glycolysis pathway in GSE14520. (C) Bar plot showing the hazard ratio of glycolysis-related genes in The Cancer Genome Atlas (TCGA) cohort using the univariate Cox regression. The bars represent the 95% CI. (D) Correlation between the AGI and the selected signature genes in the TCGA cohort. (E) Boxplots showing AGI differences in normal and tumor tissues in the TCGA, GSE64041, GSE14520 and LIRI JP datasets. (F) Boxplots showing AGI differences in normal and tumor tissues in the SRRSH set. (G) Receiver operating characteristic (ROC) curves for tissue type prediction using the AGI as the predictor.
Figure 3
Figure 3
The landscape of biological processes and characteristics of the aerobic glycolysis index (AGI) subgroups. (A) Heatmap of common differentially expressed genes based on the expression data in the high and low AGI groups. (B) Box plots showing the expression of the selected glycolysis-related genes in The Cancer Genome Atlas (TCGA) cohort. (C) Proportion of TP53 and CTNNB1 mutations in the high and low AGI groups. (D) Box plots showing the AGI in patients with TP53 mutations and wild-type TP53 (left) and CTNNB1 mutations and wild-type CTNNB1 (right). (E) The oncoPrint of copy number variations was constructed in the high and low AGI subgroups. (F) Activated gene sets enriched in the high AGI subgroup. (G) Suppressed gene sets enriched in the high AGI group. (H,I) Proteins positively (H) and negatively (I) correlated with the AGI (P < 0.05 for all proteins) based on reverse-phase protein arrays analysis of 181 samples from the TCGA using Spearman's rank correlation.
Figure 4
Figure 4
Clinicopathological significance and prognosis prediction value of the AGI. (A) Tumor differentiation grade. (B) T stage. (C) Tumor–node–metastasis (TNM) stage. (D) Vascular invasion status. (E) Recurrence status. (F) Kaplan–Meier plot analysis of overall survival (OS) in the high and low AGI groups. (G) Kaplan–Meier plot analysis of disease-free survival (DFS) in the high and low AGI groups. (H,I) Forest plot showing the prognostic value of the AGI and clinical characteristics using univariate (H) and multivariate (I) analysis. (J) Time-dependent receiver operating characteristic (ROC) analysis comparing the AGI in predicting the 1-, 3-, and 5-year OS. (K) Time-dependent ROC analysis comparing the AGI and clinical characteristics in 5-year OS. *P < 0.05, **P < 0.01, ***P < 0.001, ****P < 0.0001.
Figure 5
Figure 5
Validating the prognostically predictive value of the aerobic glycolysis index (AGI) in validation datasets. (A–C) Value of the AGI in different tumor stages in GSE14520 (A), LIRI-JP (B), and SRRSH set (C). (D–F) The heatmap and distribution of the 14 AGI-related gene expression profiles in GSE14520 (D), LIRI-JP (E), and SRRSH set (F). (G–I) Kaplan–Meier plot analysis of overall survival (OS) in the high and low AGI subgroups in GSE14520 (G), LIRI-JP (H), and SRRSH set (I). (J) Time-dependent ROC analysis comparing the predictive value of the AGI for 5-year OS in the three datasets. (K,L) Kaplan–Meier plot analysis of disease-free survival (DFS) in the high and low AGI subgroups in GSE14520 (K) and SRRSH set (L). *P < 0.05, **P < 0.01, ***P < 0.001.
Figure 6
Figure 6
Association between the aerobic glycolysis index (AGI) and Sorafenib resistance. (A) The Gene Set Variation Analysis (GSVA) results showed that the Sorafenib sensitivity signature was enriched in patients with a low AGI. (B) AGI positively was correlated with the IC50 of Sorafenib in hepatocellular carcinoma (HCC) cell line data from the Genomics of Drug Sensitivity in Cancer (GDSC) database. (C) The IC50 of Sorafenib in HCC cell line data from the GDSC database with high and low AGIs. (D) AGI positively correlated with the EC50 of Sorafenib in HCC cell line data from the Cancer Cell Line Encyclopedia (CCLE) database. (E) EC50 of Sorafenib in HCC cell line data from the CCLE database with high and low AGIs. (F) Patient sensitive to Sorafenib presented significantly low AGI. (G) The heatmap and distribution of the 14 AGI-related gene expression profiles in GSE109211. (H) Receiver operating characteristic (ROC) analysis showed an area under the curve (AUC) of 0.879 for the AGI in predicting the response to Sorafenib.
Figure 7
Figure 7
Aerobic glycolysis index (AGI) is increased in Sorafenib-resistant hepatocellular carcinoma (HCC) cells. (A) Relative expression of AGI-related genes in HCC cell lines (left, SK-hep-1; right, Huh7) incubated with Sorafenib (5 μM) for 24, 36, and 72 h. (B) Distribution of the 14 AGI-related gene expression profiles in parental and Sorafenib-resistant HCC cell lines (SK-hep-1, Huh7). (C) AGI of Sorafenib-sensitive and Sorafenib-resistant xenografts from the GSE73571 dataset. (D) Combination of 2-DG and Sorafenib resulted in significantly decreased cell viability. (E) Combination of 2-DG and Sorafenib enhanced the apoptosis of Sorafenib-resistant cell lines (SK-hep-1 SR and Huh7 SR). *P < 0.05, **P < 0.01, ***P < 0.001.

Similar articles

Cited by

References

    1. Bray F, Ferlay J, Soerjomataram I, Siegel RL, Torre LA, Jemal A. Global cancer statistics 2018: GLOBOCAN estimates of incidence and mortality worldwide for 36 cancers in 185 countries. CA Cancer J Clin. (2018) 68:394–424. 10.3322/caac.21492 - DOI - PubMed
    1. Roayaie S, Obeidat K, Sposito C, Mariani L, Bhoori S, Pellegrinelli A, et al. . Resection of hepatocellular cancer ≤ 2 cm: results from two Western centers. Hepatology. (2013) 57:1426–35. 10.1002/hep.25832 - DOI - PMC - PubMed
    1. Sapisochin G, Castells L, Dopazo C, Bilbao I, Minguez B, Lázaro JL, et al. . Single HCC in cirrhotic patients: liver resection or liver transplantation? Long-term outcome according to an intention-to-treat basis. Ann Surg Oncol. (2013) 20:1194–202. 10.1245/s10434-012-2655-1 - DOI - PubMed
    1. Vitale A, Peck-Radosavljevic M, Giannini EG, Vibert E, Sieghart W, Van Poucke S, et al. . Personalized treatment of patients with very early hepatocellular carcinoma. J Hepatol. (2017) 66:412–23. 10.1016/j.jhep.2016.09.012 - DOI - PubMed
    1. Villanueva A. Hepatocellular carcinoma. N Engl J Med. (2019) 380:1450–62. 10.1056/NEJMra1713263 - DOI - PubMed

LinkOut - more resources