

ALOX5AP Predicts Poor Prognosis by Enhancing M2 Macrophages Polarization and Immunosuppression in Serous Ovarian Cancer Microenvironment
- PMID: 34094977
- PMCID: PMC8172172
- DOI: 10.3389/fonc.2021.675104
ALOX5AP Predicts Poor Prognosis by Enhancing M2 Macrophages Polarization and Immunosuppression in Serous Ovarian Cancer Microenvironment
Abstract
Background: Serous ovarian cancer (SOC) is a highly lethal gynecological malignancy with poor prognosis. Given the importance of the immune-related tumor microenvironment (TME) in ovarian cancer, investigating tumor-immune interactions and identifying novel prognostic and therapeutic targets in SOC is a promising avenue of research. ALOX5AP (Arachidonate 5-Lipoxygenase Activating Protein) is a key enzyme in converting arachidonic acid to leukotriene: a crucial immune-modulating lipid mediator. However, the role of ALOX5AP in SOC has yet to be studied.
Methods: ALOX5AP expression patterns across ovarian cancer and their normal tissue counterparts were cross-checked using public microarray and RNA-seq analyses and then validated in clinical samples by qRT-PCR. Kaplan-Meier survival analysis was performed in multiple independent SOC patient cohorts. Univariate and multivariate Cox regression analysis were then employed to identify clinical risk parameters associated with survival, and a genomic-clinicopathologic nomogram was built. Gene enrichment, immune infiltration, and immunosuppressor correlation analyses were then evaluated.
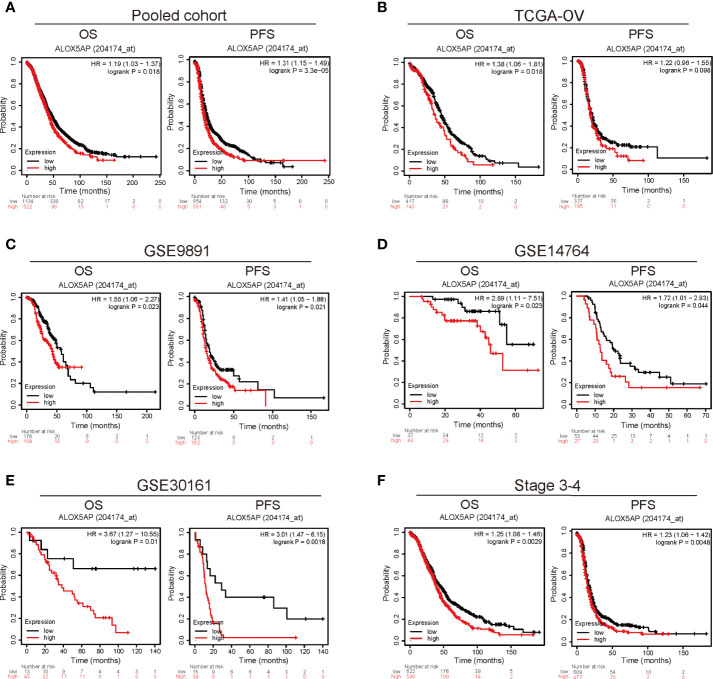
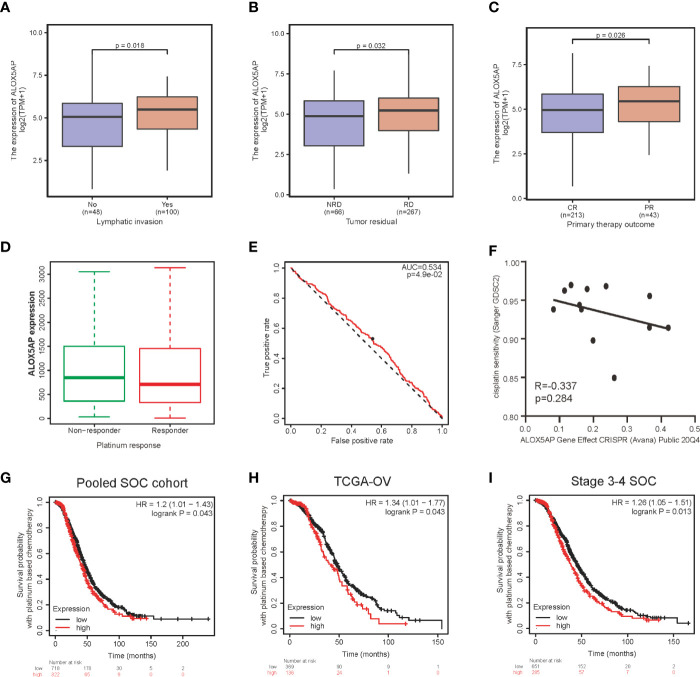
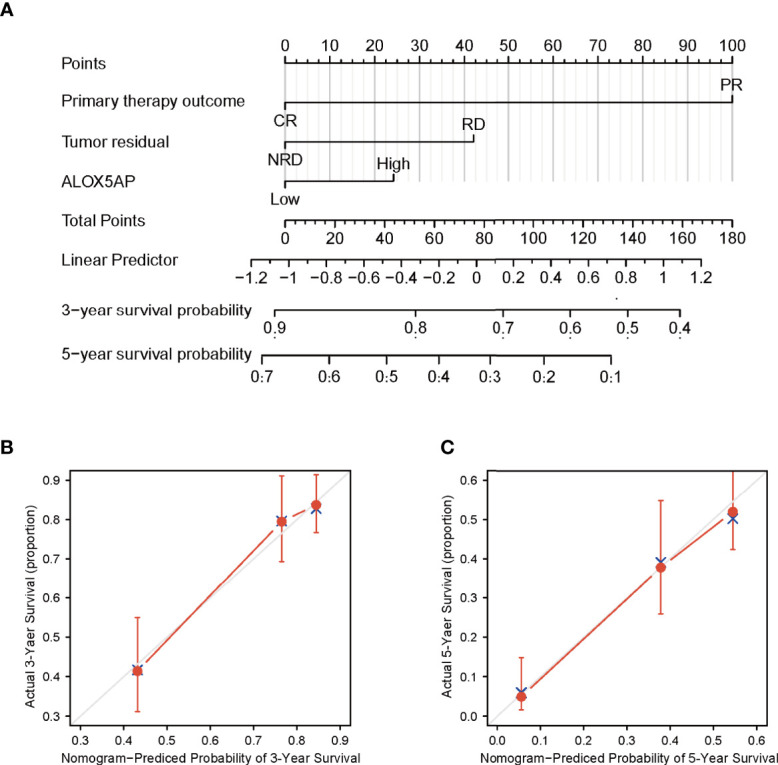
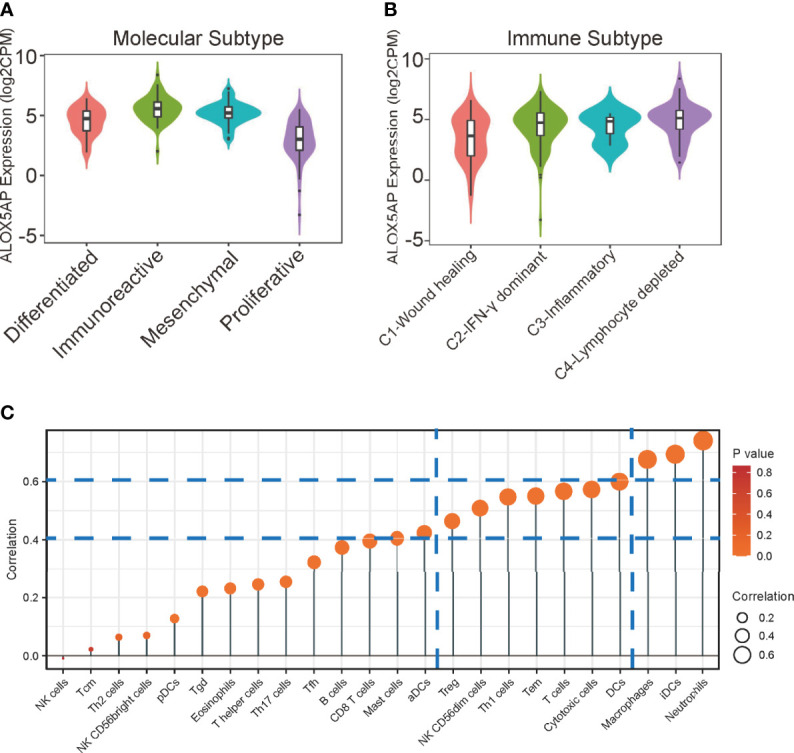
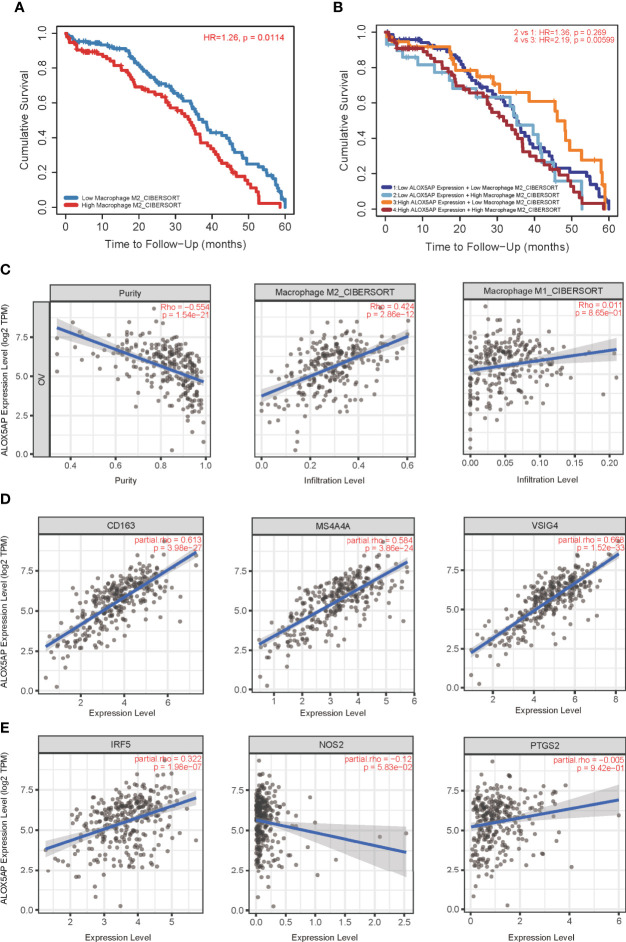
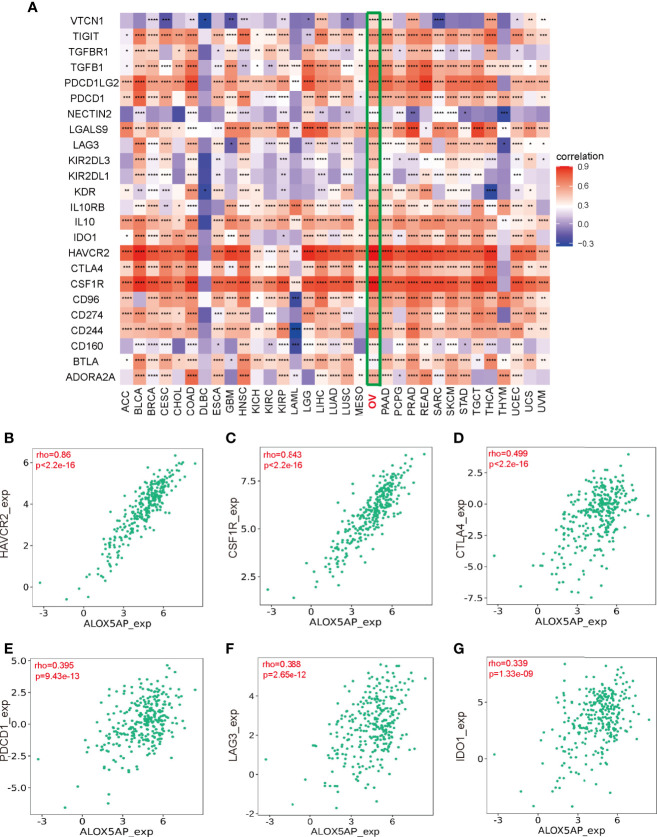
Results: ALOX5AP mRNA levels in SOC tissues were significantly upregulated compared to normal tissues. Elevated ALOX5AP was markedly associated with poor overall survival and progression-free survival in multiple SOC patient cohorts as well as with adverse clinicopathological features, including lymphatic invasion, unsatisfactory cytoreductive surgery, rapid relapse after primary treatment, and platinum non-responsiveness. A predictive nomogram, which integrated ALOX5AP expression and two independent prognosis factors (primary therapy outcome and tumor residual), was conducted to predict the 3-year and 5-year survival rate of SOC patients. Mechanistically, functional and pathway enrichment analyses revealed that ALOX5AP was primarily involved in immune response and regulation. Further exploration demonstrated that ALOX5AP was highly expressed in the immunoreactive subtype of ovarian cancer and closely related to immunocyte infiltration, especially M2 macrophage polarization. Additionally, ALOX5AP was enriched in the C4 (lymphocyte depleted) immune subtype of SOC and associated with crucial immune-repressive receptors in the tumor microenvironment at the genomic level.
Conclusions: ALOX5AP expression indicates a worse survival outcome and has the potential to be utilized as a prognostic predictor for SOC patients. Given the availability of well-studied ALOX5AP inhibitors, this study has immediate clinical implications for the exploitation of ALOX5AP as an immunotherapeutic target in SOC.
Keywords: ALOX5AP; immunosuppression; prognosis; serous ovarian cancer; targeted therapy.
Copyright © 2021 Ye, An, Wang, Zhang, Huang, Sun, Li, Ma, Wang and Gao.
Conflict of interest statement
The authors declare that the research was conducted in the absence of any commercial or financial relationships that could be construed as a potential conflict of interest.
Figures


Similar articles
-
Integrated bioinformatics analysis and experimental validation reveal the relationship between ALOX5AP and the prognosis and immune microenvironment in glioma.BMC Med Genomics. 2024 Aug 21;17(1):218. doi: 10.1186/s12920-024-01991-8. BMC Med Genomics. 2024. PMID: 39169376 Free PMC article.
-
Identification and Validation of a Novel Anoikis-Related Gene Signature for Predicting Survival in Patients With Serous Ovarian Cancer.World J Oncol. 2024 Feb;15(1):45-57. doi: 10.14740/wjon1714. Epub 2024 Jan 10. World J Oncol. 2024. PMID: 38274727 Free PMC article.
-
Integration of histopathological images and immunological analysis to predict M2 macrophage infiltration and prognosis in patients with serous ovarian cancer.Front Immunol. 2025 Mar 17;16:1505509. doi: 10.3389/fimmu.2025.1505509. eCollection 2025. Front Immunol. 2025. PMID: 40165975 Free PMC article.
-
Construction and Investigation of an LINC00284-Associated Regulatory Network in Serous Ovarian Carcinoma.Dis Markers. 2020 Jan 21;2020:9696285. doi: 10.1155/2020/9696285. eCollection 2020. Dis Markers. 2020. PMID: 32076467 Free PMC article.
-
Role of tumor microenvironment in ovarian cancer pathobiology.Oncotarget. 2018 Apr 27;9(32):22832-22849. doi: 10.18632/oncotarget.25126. eCollection 2018 Apr 27. Oncotarget. 2018. PMID: 29854318 Free PMC article. Review.
Cited by
-
ALOX5AP suppresses osteosarcoma progression via Wnt/β-catenin/EMT pathway and associates with clinical prognosis and immune infiltration.J Orthop Surg Res. 2023 Jun 22;18(1):446. doi: 10.1186/s13018-023-03919-x. J Orthop Surg Res. 2023. PMID: 37344882 Free PMC article.
-
Single-cell profiling reveals tumour cell heterogeneity accompanying a pre-malignant and immunosuppressive microenvironment in gastric adenocarcinoma.Clin Transl Med. 2023 Dec;13(12):e1490. doi: 10.1002/ctm2.1490. Clin Transl Med. 2023. PMID: 38037525 Free PMC article. No abstract available.
-
Integration Analysis of Single-Cell Multi-Omics Reveals Prostate Cancer Heterogeneity.Adv Sci (Weinh). 2024 May;11(18):e2305724. doi: 10.1002/advs.202305724. Epub 2024 Mar 14. Adv Sci (Weinh). 2024. PMID: 38483933 Free PMC article.
-
ALOX5AP is an Indicator for High CD8 Lymphocyte Infiltration and "Hot" Tumor Microenvironment in Osteosarcoma: A Bioinformatic Study.Biochem Genet. 2023 Dec;61(6):2363-2381. doi: 10.1007/s10528-023-10374-0. Epub 2023 Apr 11. Biochem Genet. 2023. PMID: 37041365
-
Integrated bioinformatics analysis and experimental validation reveal the relationship between ALOX5AP and the prognosis and immune microenvironment in glioma.BMC Med Genomics. 2024 Aug 21;17(1):218. doi: 10.1186/s12920-024-01991-8. BMC Med Genomics. 2024. PMID: 39169376 Free PMC article.
References
LinkOut - more resources
Full Text Sources
Miscellaneous