

Loss of Pde6a Induces Rod Outer Segment Shrinkage and Visual Alterations in pde6aQ70X Mutant Zebrafish, a Relevant Model of Retinal Dystrophy
- PMID: 34095146
- PMCID: PMC8173125
- DOI: 10.3389/fcell.2021.675517
Loss of Pde6a Induces Rod Outer Segment Shrinkage and Visual Alterations in pde6aQ70X Mutant Zebrafish, a Relevant Model of Retinal Dystrophy
Abstract
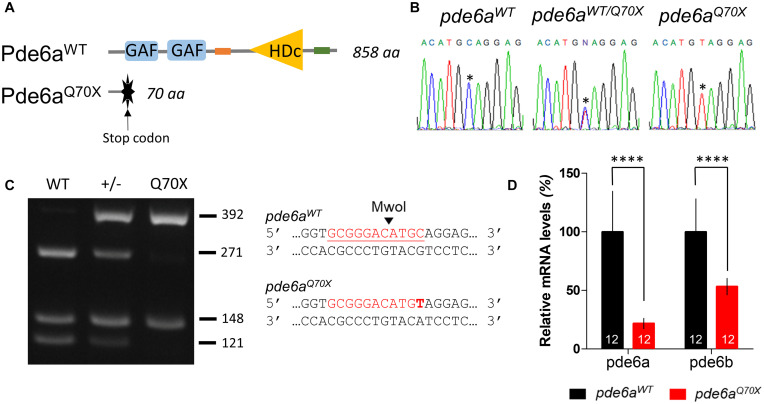
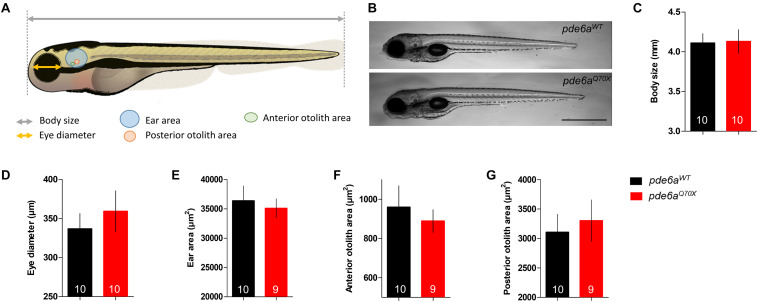
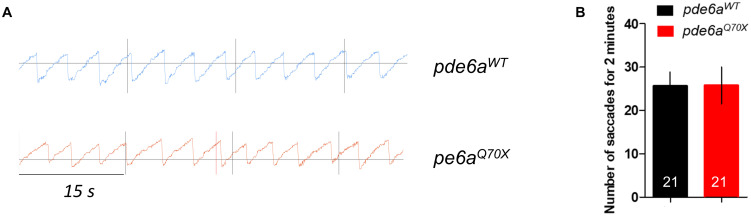
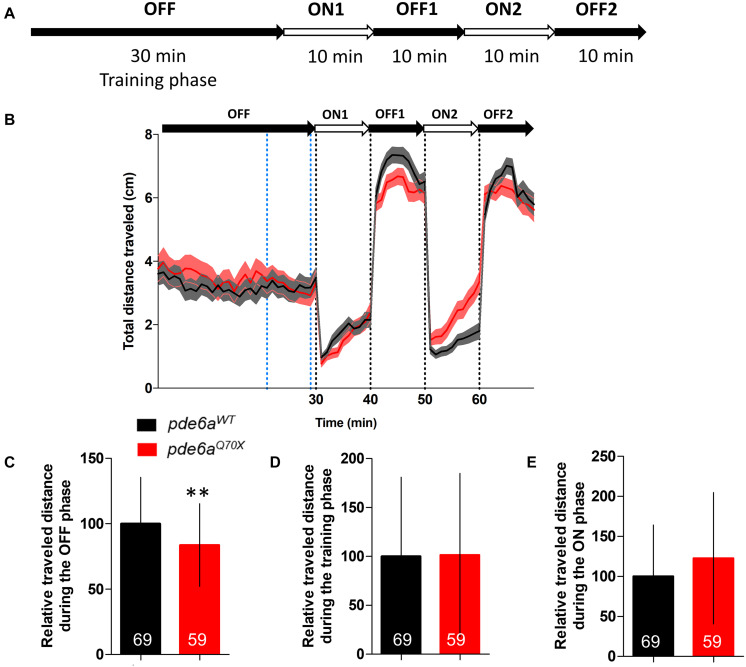
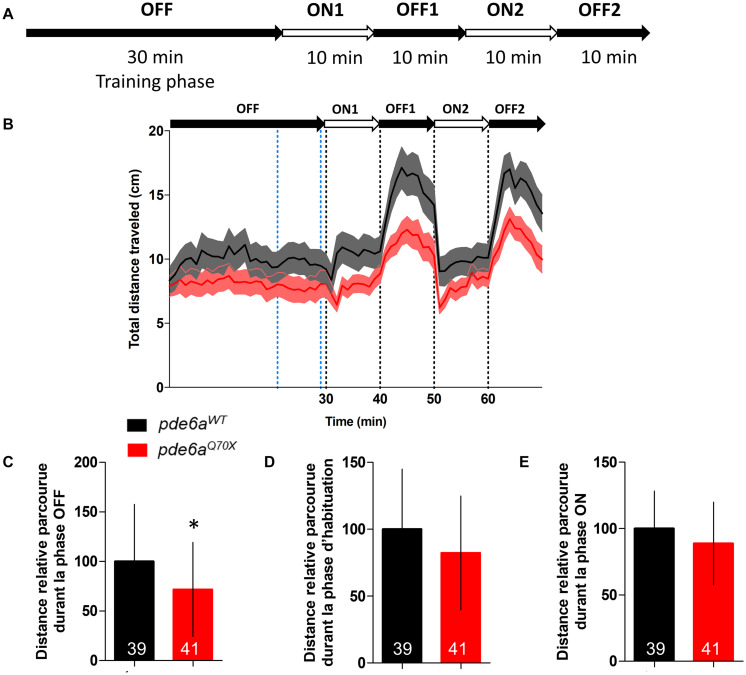
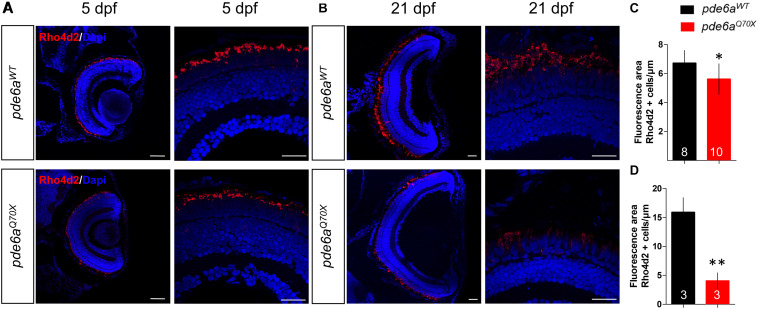
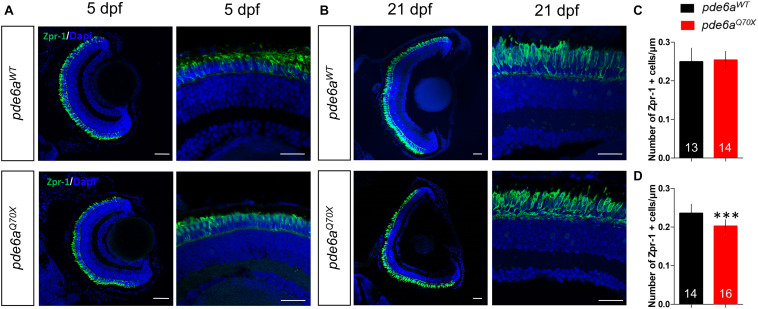
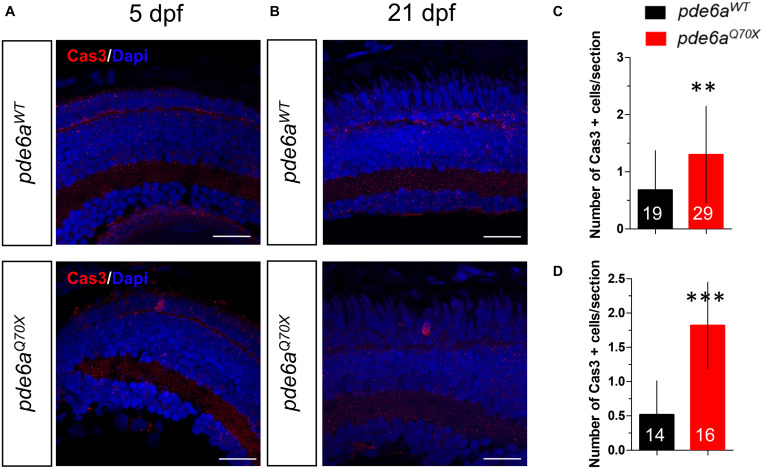
Retinitis pigmentosa (RP) is one of the most common forms of inherited retinal degeneration with 1/4,000 people being affected. The vision alteration primarily begins with rod photoreceptor degeneration, then the degenerative process continues with cone photoreceptor death. Variants in 71 genes have been linked to RP. One of these genes, PDE6a is responsible for RP43. To date no treatment is available and patients suffer from pronounced visual impairment in early childhood. We used the novel zebrafish pde6aQ70X mutant, generated by N-ethyl-N-nitrosourea at the European Zebrafish Resource Centre, to better understand how PDE6a loss of function leads to photoreceptor alteration. Interestingly, zebrafish pde6aQ70X mutants exhibited impaired visual function at 5 dpf as evidenced by the decrease in their visual motor response (VMR) compared to pde6a WT larvae. This impaired visual function progressed with time and was more severe at 21 dpf. These modifications were associated with an alteration of rod outer segment length at 5 and 21 dpf. In summary, these findings suggest that rod outer segment shrinkage due to Pde6a deficiency begins very early in zebrafish, progresses with time. The zebrafish pde6aQ70X mutant represents an ideal model of RP to screen relevant active small molecules that will block the progression of the disease.
Keywords: PDE6A; cones; photoreceptors; retinitis pigmentosa; rods; zebrafish.
Copyright © 2021 Crouzier, Diez, Richard, Cubedo, Barbereau, Rossel, Delaunay, Maurice and Delprat.
Conflict of interest statement
The authors declare that the research was conducted in the absence of any commercial or financial relationships that could be construed as a potential conflict of interest.
Figures
Similar articles
-
Gene Supplementation Rescues Rod Function and Preserves Photoreceptor and Retinal Morphology in Dogs, Leading the Way Toward Treating Human PDE6A-Retinitis Pigmentosa.Hum Gene Ther. 2017 Dec;28(12):1189-1201. doi: 10.1089/hum.2017.155. Hum Gene Ther. 2017. PMID: 29212382
-
Gene Therapy Successfully Delays Degeneration in a Mouse Model of PDE6A-Linked Retinitis Pigmentosa (RP43).Hum Gene Ther. 2017 Dec;28(12):1180-1188. doi: 10.1089/hum.2017.156. Hum Gene Ther. 2017. PMID: 29212391
-
Double cone dystrophy and RPE degeneration in the retina of the zebrafish gnn mutant.Invest Ophthalmol Vis Sci. 2003 Mar;44(3):1287-98. doi: 10.1167/iovs.02-0363. Invest Ophthalmol Vis Sci. 2003. PMID: 12601061
-
Metabolic rescue of cone photoreceptors in retinitis pigmentosa.Taiwan J Ophthalmol. 2021 Dec 6;11(4):331-335. doi: 10.4103/tjo.tjo_46_21. eCollection 2021 Oct-Dec. Taiwan J Ophthalmol. 2021. PMID: 35070660 Free PMC article. Review.
-
Non-syndromic retinitis pigmentosa.Prog Retin Eye Res. 2018 Sep;66:157-186. doi: 10.1016/j.preteyeres.2018.03.005. Epub 2018 Mar 27. Prog Retin Eye Res. 2018. PMID: 29597005 Review.
Cited by
-
Models of Photoreceptor Degeneration in Adult Zebrafish.Methods Mol Biol. 2025;2848:75-84. doi: 10.1007/978-1-0716-4087-6_5. Methods Mol Biol. 2025. PMID: 39240517
-
A comparative analysis of gene and protein expression in chronic and acute models of photoreceptor degeneration in adult zebrafish.Front Cell Dev Biol. 2023 Sep 7;11:1233269. doi: 10.3389/fcell.2023.1233269. eCollection 2023. Front Cell Dev Biol. 2023. PMID: 37745292 Free PMC article.
-
The USH3A causative gene clarin1 functions in Müller glia to maintain retinal photoreceptors.PLoS Genet. 2025 Mar 11;21(3):e1011205. doi: 10.1371/journal.pgen.1011205. eCollection 2025 Mar. PLoS Genet. 2025. PMID: 40067805 Free PMC article.
-
Use of Zebrafish Models to Boost Research in Rare Genetic Diseases.Int J Mol Sci. 2021 Dec 12;22(24):13356. doi: 10.3390/ijms222413356. Int J Mol Sci. 2021. PMID: 34948153 Free PMC article. Review.
-
The USH3A causative gene clarin1 functions in Müller glia to maintain retinal photoreceptors.bioRxiv [Preprint]. 2024 Mar 1:2024.02.29.582878. doi: 10.1101/2024.02.29.582878. bioRxiv. 2024. Update in: PLoS Genet. 2025 Mar 11;21(3):e1011205. doi: 10.1371/journal.pgen.1011205. PMID: 38464015 Free PMC article. Updated. Preprint.
References
-
- Brady C. A., Rennekamp A. J., Peterson R. T. (2016). Chemical screening in zebrafish. Methods Mol. Biol. 1451 3–16. - PubMed
LinkOut - more resources
Full Text Sources
Molecular Biology Databases