. 2021 May 19:8:663121.
doi: 10.3389/fmolb.2021.663121. eCollection 2021.

HEMNMA-3D: Cryo Electron Tomography Method Based on Normal Mode Analysis to Study Continuous Conformational Variability of Macromolecular Complexes

Affiliations

HEMNMA-3D: Cryo Electron Tomography Method Based on Normal Mode Analysis to Study Continuous Conformational Variability of Macromolecular Complexes

Mohamad Harastani et al. Front Mol Biosci. .

Abstract

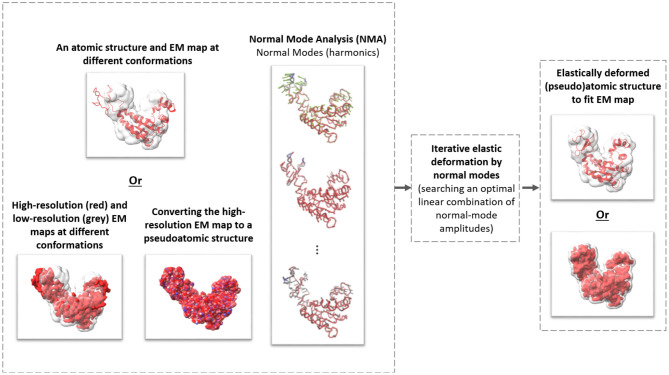
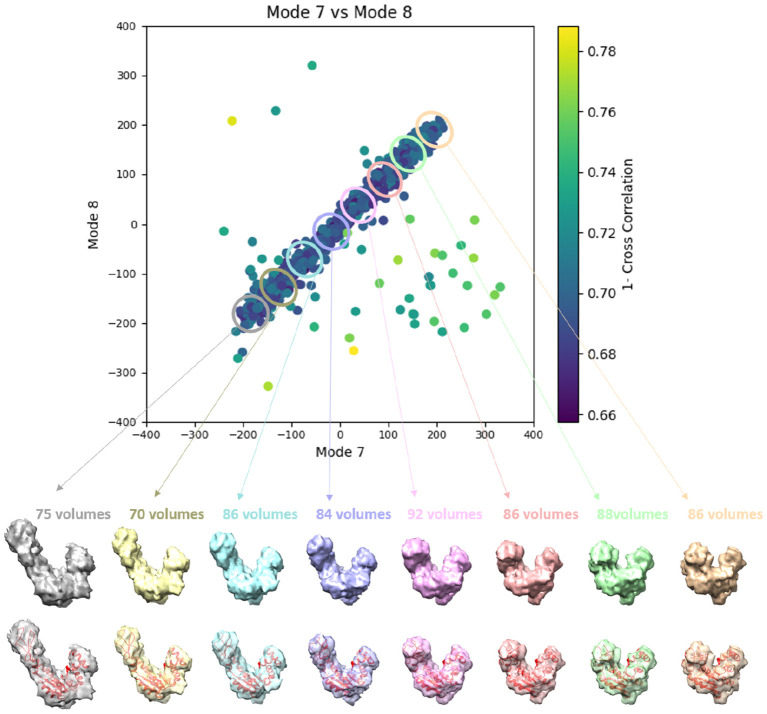
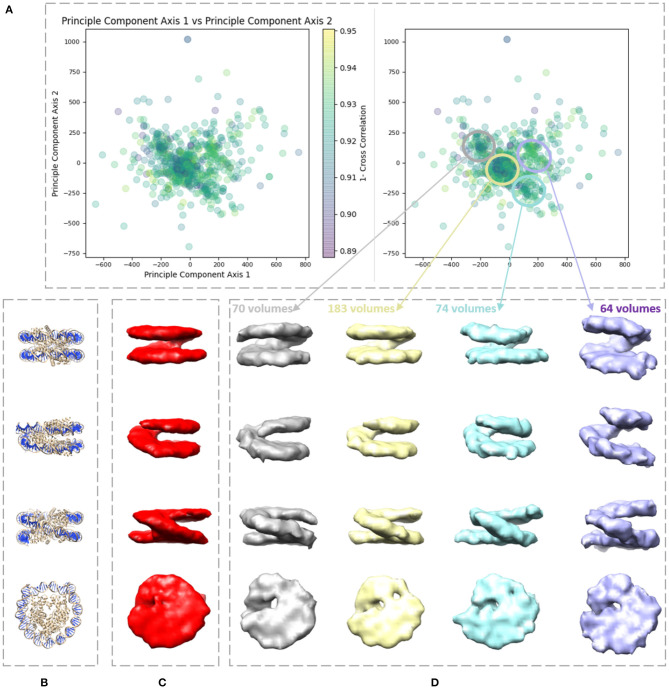
Cryogenic electron tomography (cryo-ET) allows structural determination of biomolecules in their native environment (in situ). Its potential of providing information on the dynamics of macromolecular complexes in cells is still largely unexploited, due to the challenges of the data analysis. The crowded cell environment and continuous conformational changes of complexes make difficult disentangling the data heterogeneity. We present HEMNMA-3D, which is, to the best of our knowledge, the first method for analyzing cryo electron subtomograms in terms of continuous conformational changes of complexes. HEMNMA-3D uses a combination of elastic and rigid-body 3D-to-3D iterative alignments of a flexible 3D reference (atomic structure or electron microscopy density map) to match the conformation, orientation, and position of the complex in each subtomogram. The elastic matching combines molecular mechanics simulation (Normal Mode Analysis of the 3D reference) and experimental, subtomogram data analysis. The rigid-body alignment includes compensation for the missing wedge, due to the limited tilt angle of cryo-ET. The conformational parameters (amplitudes of normal modes) of the complexes in subtomograms obtained through the alignment are processed to visualize the distribution of conformations in a space of lower dimension (typically, 2D or 3D) referred to as space of conformations. This allows a visually interpretable insight into the dynamics of the complexes, by calculating 3D averages of subtomograms with similar conformations from selected (densest) regions and by recording movies of the 3D reference's displacement along selected trajectories through the densest regions. We describe HEMNMA-3D and show its validation using synthetic datasets. We apply HEMNMA-3D to an experimental dataset describing in situ nucleosome conformational variability. HEMNMA-3D software is available freely (open-source) as part of ContinuousFlex plugin of Scipion V3.0 (http://scipion.i2pc.es).

Keywords: continuous conformational changes; cryo electron tomography; flexible-reference alignment; normal mode analysis; nucleosomes in situ.


Conflict of interest statement

The authors declare that the research was conducted in the absence of any commercial or financial relationships that could be construed as a potential conflict of interest.

Figures

Figure 1
Figure 1
The general scheme of elastic deforming of a reference structure (atomic or pseudoatomic) using normal modes to fit a density map (e.g., an EM map or a subtomogram average).
Figure 2
Figure 2
Flowchart of HEMNMA-3D. (A) Workflow. (B) Combined iterative elastic and rigid-body 3D-to-3D alignment step (the core module of HEMNMA-3D).
Figure 3
Figure 3
A graphical summary of the dataflow of HEMNMA-3D. (A) Input subtomograms containing the same biomolecule but at different orientations, positions and conformations (here represented with a low level of noise for illustration). (B) Input subtomograms projected onto a low-dimensional “space of conformations,” describing and visualizing the biomolecular conformational variability contained in the subtomograms. (C) Grouping of close points (subtomograms with similar biomolecular conformations) and averaging of subtomograms in these groups. (D) Animating biomolecular motion along trajectories identified in the densest regions.
Figure 4
Figure 4
Flowcharts of synthesis of the datasets used for testing and validating HEMNMA-3D, namely “Discrete” dataset (left) and “Continuous” dataset (right).
Figure 5
Figure 5
Examples of synthetic subtomograms containing the same molecule but at different orientations, positions and conformations, for two different noise levels. (A) Low level of noise (SNR = 0.5). (B) High level of noise (SNR = 0.01).
Figure 6
Figure 6
Plots showing the output of the 3D-to-3D elastic and rigid-body alignment module of HEMNMA-3D with “Discrete” dataset (synthetic subtomograms are simulating discrete conformational heterogeneity). (A) Use of the atomic structure (chain A of PDB:4AKE) and its normal modes to estimate the conformational parameters (normal-mode amplitudes) and rigid-body parameters (orientation and shift) of the molecules in the input synthetic subtomograms. (B) Use of a pseudoatomic structure (from a simulated density map) and its normal modes to estimate the conformational and rigid-body parameters of the molecules in the input synthetic subtomograms. The goal was the retrieval of the ground-truth relationship between the amplitudes along normal modes 7 and 8; ideally, all data should lay in one of the following three clusters of normal-mode amplitudes: (mode 7, mode 8) ∈ {(-150, 0), (150, 0), (0, 150)}; each point in the plot represents a subtomogram and close points represent similar conformations. Note that the dashed curves enclose the data points where p-value > 0.01 in Table 1. See the text for more details on this experiment.
Figure 7
Figure 7
Averages of the three groups (enclosed by ellipses) of subtomograms identified from the output of the 3D-to-3D elastic and rigid-body alignment module of HEMNMA-3D with “Discrete” dataset (shown in Figure 6A), using the atomic structure (chain A of PDB:4AKE) and its normal modes to estimate the conformational parameters (normal-mode amplitudes) and rigid-body parameters (orientation and shift) of the molecules in the input synthetic subtomograms. Subtomograms are represented by points and close points represent similar conformations. The numbers of volumes written above the shown subtomogram averages are the numbers of synthetic subtomograms used for computing these subtomogram averages (the numbers of points enclosed by the corresponding ellipses). On the bottom, the subtomogram averages are shown at 50% transparency along with the corresponding ground-truth deformed atomic structure (in red).
Figure 8
Figure 8
Plots showing the output of the 3D-to-3D elastic and rigid-body alignment module of HEMNMA-3D with “Continuous” dataset (synthetic subtomograms are simulating continuous conformational heterogeneity). (A) Use of the atomic structure (chain A of PDB:4AKE) and its normal modes to estimate the conformational parameters (normal-mode amplitudes) and rigid-body parameters (orientation and shift) of the molecules in the input synthetic subtomograms. (B) Use of a pseudoatomic structure (from a simulated density map) and its normal modes to estimate the conformational and rigid-body parameters of the molecules in the input synthetic subtomograms. The goal was the retrieval of the ground-truth relationship between the amplitudes along normal modes 7 and 8 (ideally linear relationship, with equal amplitudes of normal modes 7 and 8); each point in the plot represents a subtomogram and close points represent similar conformations. Note that the dashed ellipses enclose the data points where p-value > 0.001 in Table 2. See the text for more details on this experiment.
Figure 9
Figure 9
Averages of eight groups (enclosed by ellipses) of subtomograms identified from the output of the 3D-to-3D elastic and rigid-body alignment module of HEMNMA-3D with “Continuous” dataset (shown in Figure 8A), using the atomic structure (chain A of PDB:4AKE) and its normal modes to estimate the conformational parameters (normal-mode amplitudes) and rigid-body parameters (orientation and shift) of the molecules in the input synthetic subtomograms. Subtomograms are represented by points and close points represent similar conformations. The numbers of volumes written above the shown subtomogram averages are the numbers of synthetic subtomograms used for computing these subtomogram averages (the numbers of points enclosed by the corresponding ellipses). On the bottom, the subtomogram averages are shown at 50% transparency along with the corresponding theoretical centroid deformed atomic structure (in red).
Figure 10
Figure 10
Illustration of HEMNMA-3D use with in situ cryo-ET nucleosome dataset. (A) Space of conformations resulting from projecting the estimated amplitudes of six normal modes onto a two-dimensional space using PCA. (B) Nucleosome atomic structure PDB:3w98, for comparison purposes. (C) Nucleosome subtomogram average (around 2 nm resolution) used as the input reference density map for HEMNMA-3D, obtained by classical subtomogram averaging, without taking into account conformational heterogeneity [for more information on how this global initial subtomogram average was obtained, see section 1 of the Supplementary Material (Nucleosome data preparation and acquisition)]. (D) Four subtomogram averages from four densest regions in the space of conformations (regions encircled with ellipses) showing different nucleosome conformations, mainly, different gap distances between the nucleosome gyres. The numbers of volumes written above the subtomogram averages shown in (D) are the numbers of in situ cryo-ET subtomograms used for computing these subtomogram averages (the numbers of points enclosed by the corresponding ellipses).
Figure 11
Figure 11
Displacement of the reference density map along two directions D1 and D2 in the space of conformations obtained (Figure 10) with HEMNMA-3D with in situ cryo-ET nucleosome dataset. (A) Space of conformations (left) as shown in Figure 10 and two directions D1 and D2 used to displace the reference density map (Figure 10C) in this space (right). (B) Displacement of the reference density map along the D1 and D2 directions (10 frames of the corresponding trajectory are shown row-wise).

Similar articles

Cited by

References

    1. Abeyrathne P. D., San Koh C., Grant T., Grigorieff N., Korostelev A. A. (2016). Ensemble cryo-em uncovers inchworm-like translocation of a viral ires through the ribosome. Elife 5:e14874. 10.7554/eLife.14874 - DOI - PMC - PubMed
    1. Albert S., Schaffer M., Beck F., Mosalaganti S., Asano S., Thomas H. F., et al. (2017). Proteasomes tether to two distinct sites at the nuclear pore complex. Proc. Natl. Acad. Sci. U.S.A. 114, 13726–13731. 10.1073/pnas.1716305114 - DOI - PMC - PubMed
    1. Andén J. Singer A. (2018). Structural variability from noisy tomographic projections. SIAM J. Imaging Sci. 11, 1441–1492. 10.1137/17M1153509 - DOI - PMC - PubMed
    1. Banerjee S., Bartesaghi A., Merk A., Rao P., Bulfer S. L., Yan Y., et al. (2016). 2.3 å resolution cryo-em structure of human p97 and mechanism of allosteric inhibition. Science 351, 871–875. 10.1126/science.aad7974 - DOI - PMC - PubMed
    1. Berghen F. V., Bersini H. (2005). Condor, a new parallel, constrained extension of Powell's Uobyqa algorithm: experimental results and comparison with the dfo algorithm. J. Comput. Appl. Math. 181, 157–175. 10.1016/j.cam.2004.11.029 - DOI

LinkOut - more resources