

Cell Heterogeneity Analysis in Single-Cell RNA-seq Data Using Mixture Exponential Graph and Markov Random Field Model
- PMID: 34095314
- PMCID: PMC8164540
- DOI: 10.1155/2021/9919080
Cell Heterogeneity Analysis in Single-Cell RNA-seq Data Using Mixture Exponential Graph and Markov Random Field Model
Abstract
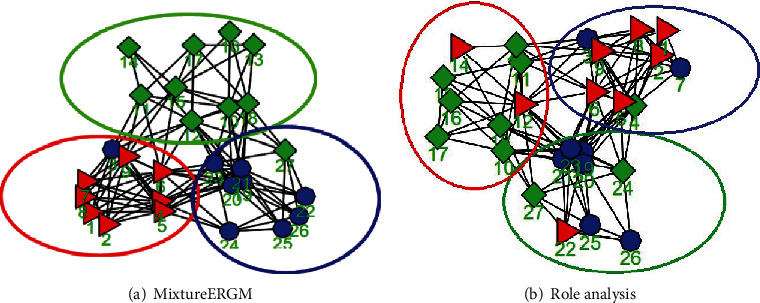
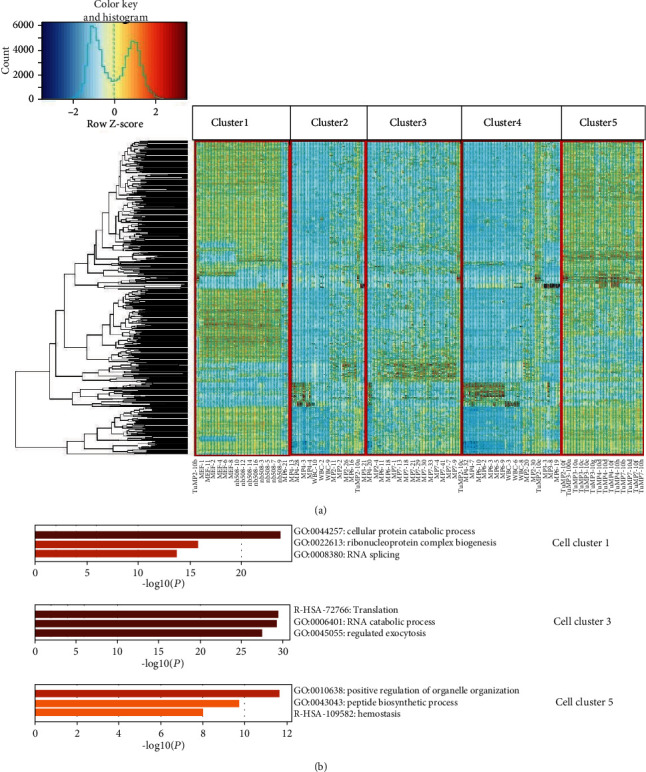
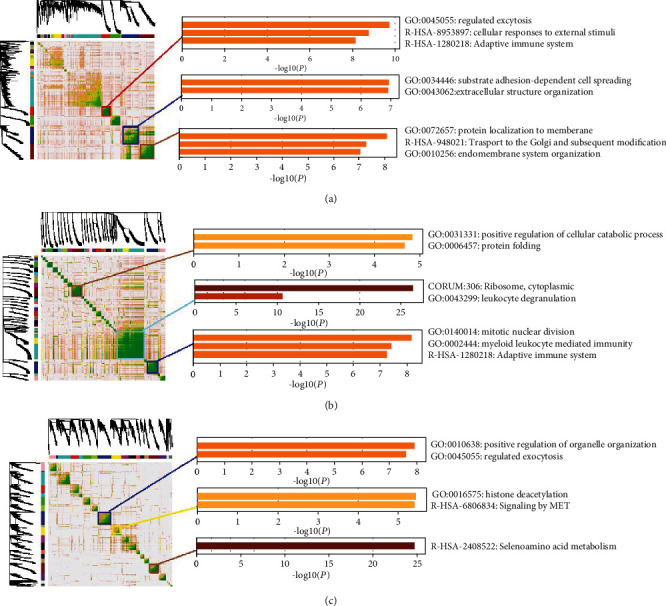
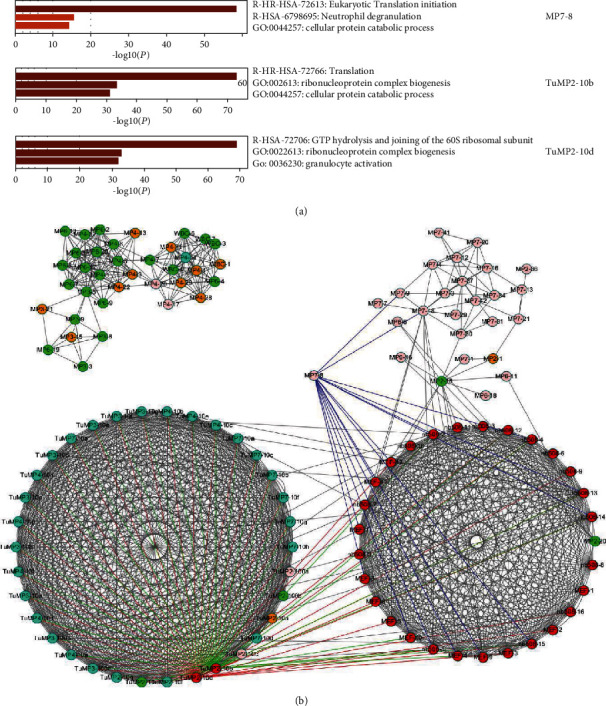
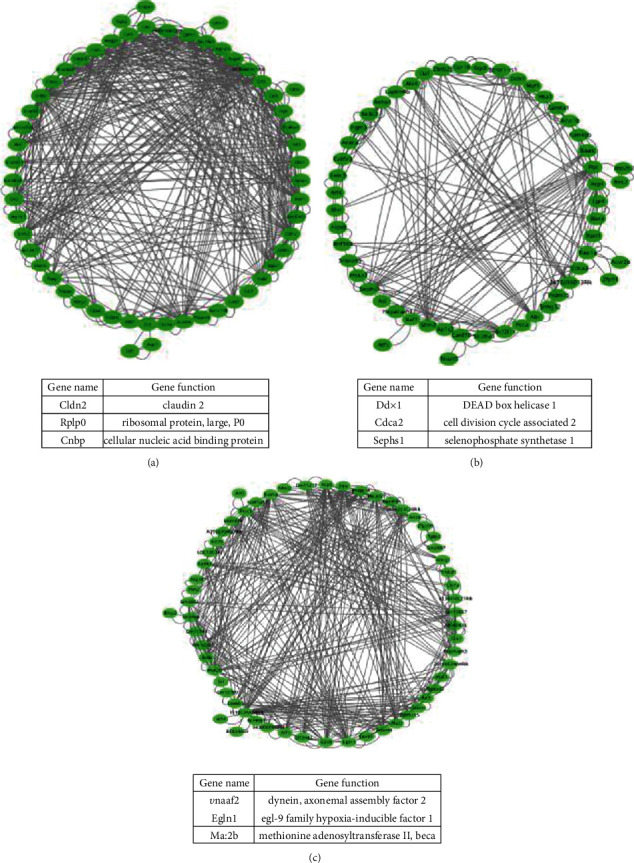
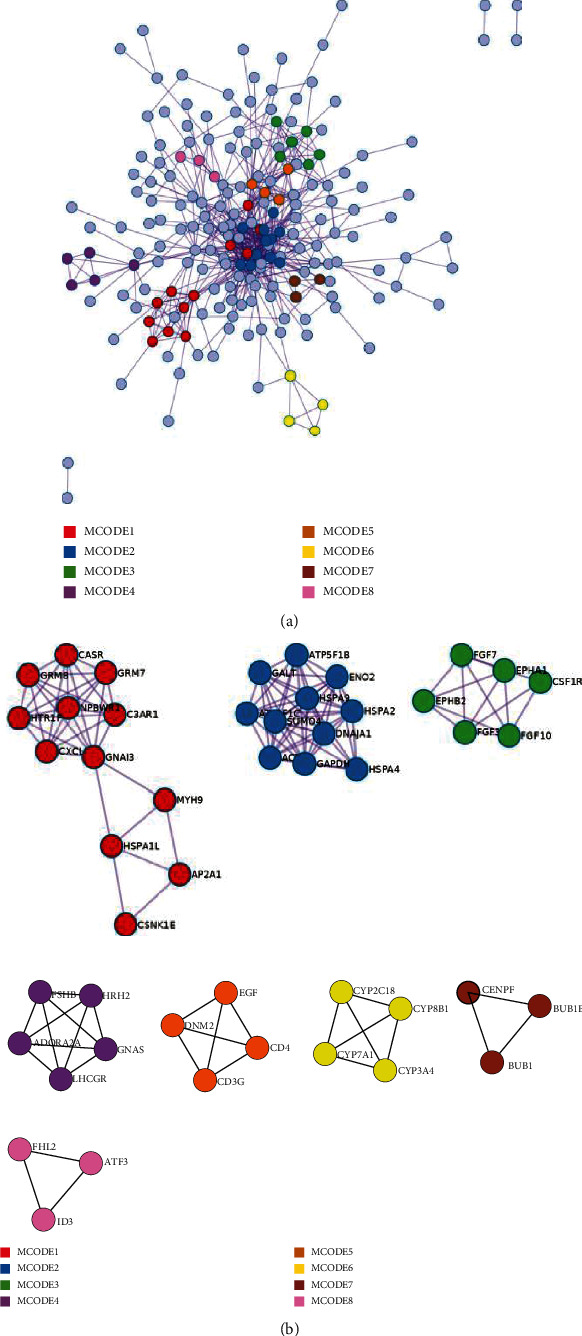
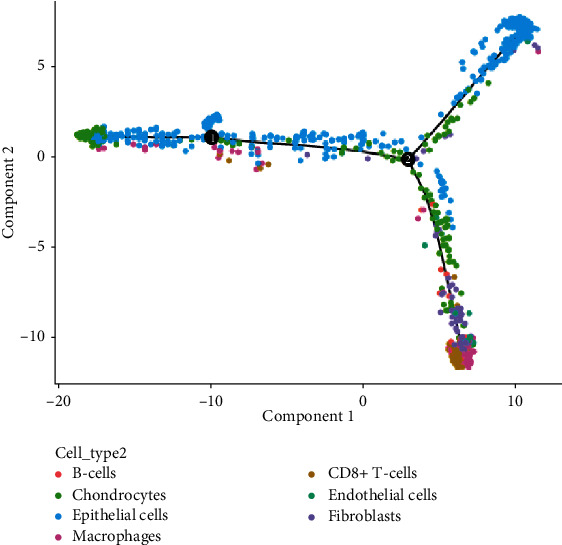
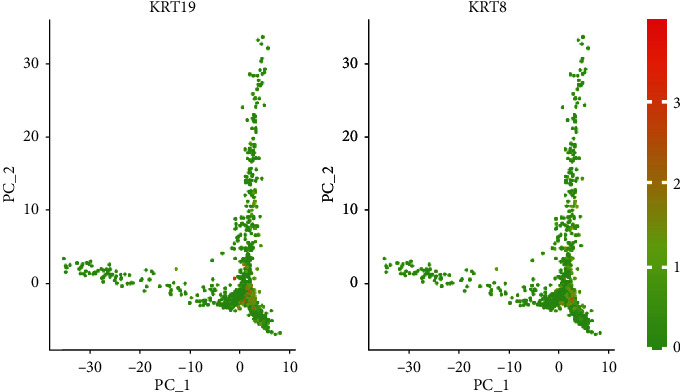
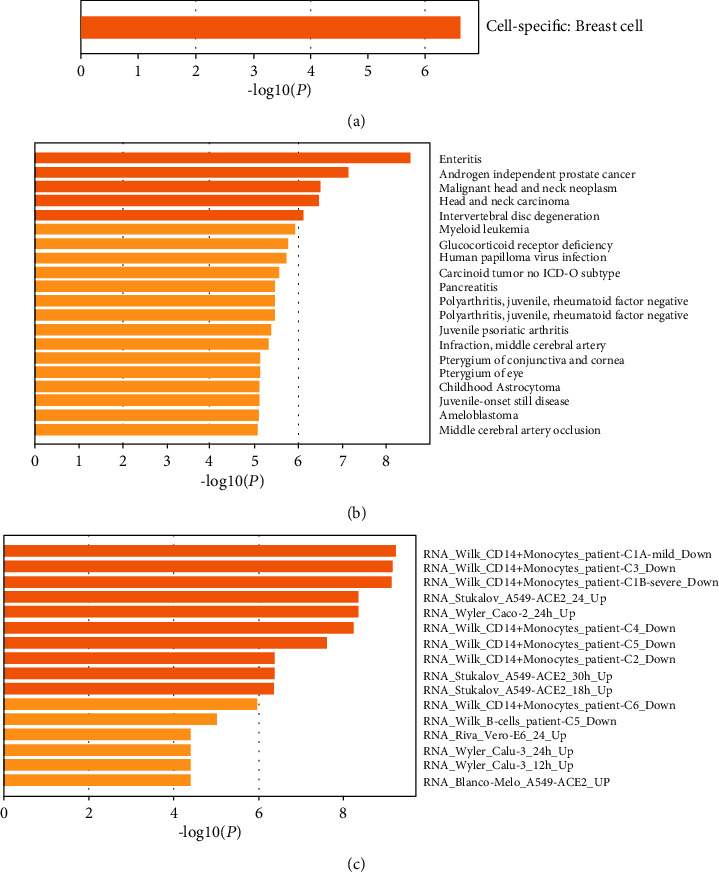
Advanced single-cell profiling technologies promote exploration of cell heterogeneity, and clustering of single-cell RNA (scRNA-seq) data enables discovery of coexpression genes and network relationships between genes. In particular, single-cell profiling of circulating tumor cells (CTCs) can provide unique insights into tumor heterogeneity (including in triple-negative breast cancer (TNBC)), while scRNA-seq leads to better understanding of subclonal architecture and biological function. Despite numerous reports suggesting a direct correlation between circulating tumor cells (CTCs) and poor clinical outcomes, few studies have provided a thorough heterogeneity characterization of CTCs. In addition, TNBC is a disease with not only intertumor but also intratumor heterogeneity and represents various biological distinct subgroups that may have relationships with immune functions that are not clearly established yet. In this article, we introduce a new scheme for detecting genotypic characterization of single-cell heterogeneities and apply it to CTC and TNBC single-cell RNA-seq data. First, we use an existing mixture exponential family graph model to partition the cell-cell network; then, with the Markov random field model, we obtain more flexible network rewiring. Finally, we find the cell heterogeneity and network relationships according to different high coexpression gene modules in different cell subsets. Our results demonstrate that this scheme provides a reasonable and effective way to model different cell clusters and different biological enrichment gene clusters. Thus, using different internal coexpression genes of different cell clusters, we can infer the differences in tumor composition and diversity.
Copyright © 2021 Yishu Wang et al.
Conflict of interest statement
The authors confirm that there are no conflicts of interest.
Figures
Similar articles
-
Revealing Cellular Heterogeneity and Key Regulatory Factors of Triple-Negative Breast Cancer through Single-Cell RNA Sequencing.Front Biosci (Landmark Ed). 2024 Aug 19;29(8):290. doi: 10.31083/j.fbl2908290. Front Biosci (Landmark Ed). 2024. PMID: 39206896
-
A hybrid deep clustering approach for robust cell type profiling using single-cell RNA-seq data.RNA. 2020 Oct;26(10):1303-1319. doi: 10.1261/rna.074427.119. Epub 2020 Jun 12. RNA. 2020. PMID: 32532794 Free PMC article.
-
Hydro-Seq enables contamination-free high-throughput single-cell RNA-sequencing for circulating tumor cells.Nat Commun. 2019 May 15;10(1):2163. doi: 10.1038/s41467-019-10122-2. Nat Commun. 2019. PMID: 31092822 Free PMC article.
-
Machine learning and statistical methods for clustering single-cell RNA-sequencing data.Brief Bioinform. 2020 Jul 15;21(4):1209-1223. doi: 10.1093/bib/bbz063. Brief Bioinform. 2020. PMID: 31243426 Review.
-
Advancements in the Application of scRNA-Seq in Breast Research: A Review.Int J Mol Sci. 2024 Dec 22;25(24):13706. doi: 10.3390/ijms252413706. Int J Mol Sci. 2024. PMID: 39769466 Free PMC article. Review.
Cited by
-
cellSight: Characterizing dynamics of cells using single-cell RNA-sequencing.bioRxiv [Preprint]. 2025 May 22:2025.05.16.654572. doi: 10.1101/2025.05.16.654572. bioRxiv. 2025. PMID: 40475686 Free PMC article. Preprint.
-
Know your molecule: pharmacological characterization of drug candidates to enhance efficacy and reduce late-stage attrition.Nat Rev Drug Discov. 2024 Aug;23(8):626-644. doi: 10.1038/s41573-024-00958-9. Epub 2024 Jun 18. Nat Rev Drug Discov. 2024. PMID: 38890494 Review.
References
-
- Wang Y., Fang H., Yang D., Zhao H., Deng M. Network clustering analysis using mixture exponential-family random graph models and its application in genetic interaction data. IEEE/ACM Transactions on Computational Biology and Bioinformatics. 2019;16(5):1743–1752. doi: 10.1109/tcbb.2017.2743711. - DOI - PubMed
MeSH terms
Substances
LinkOut - more resources
Full Text Sources
