. 2021 May 31;13(1):e12200.
doi: 10.1002/dad2.12200. eCollection 2021.

Spatio-spectral relationships between pathological neural dynamics and cognitive impairment along the Alzheimer's disease spectrum

Affiliations

Spatio-spectral relationships between pathological neural dynamics and cognitive impairment along the Alzheimer's disease spectrum

Alex I Wiesman et al. Alzheimers Dement (Amst). .

Erratum in

  • Erratum.
    [No authors listed] [No authors listed] Alzheimers Dement (Amst). 2022 Feb 11;14(1):e12257. doi: 10.1002/dad2.12257. eCollection 2022. Alzheimers Dement (Amst). 2022. PMID: 35169609 Free PMC article.

Abstract

Introduction: Numerous studies have described aberrant patterns of rhythmic neural activity in patients along the Alzheimer's disease (AD) spectrum, yet the relationships between these pathological features and cognitive decline are uncertain.

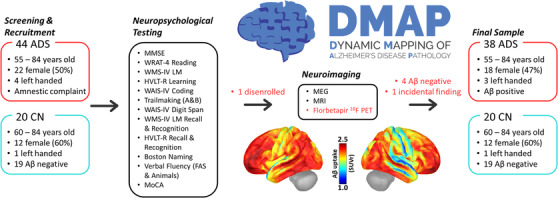
Methods: We acquired magnetoencephalography (MEG) data from 38 amyloid-PET biomarker-confirmed patients on the AD spectrum and a comparison group of biomarker-negative cognitively normal (CN) healthy adults, alongside an extensive neuropsychological battery.

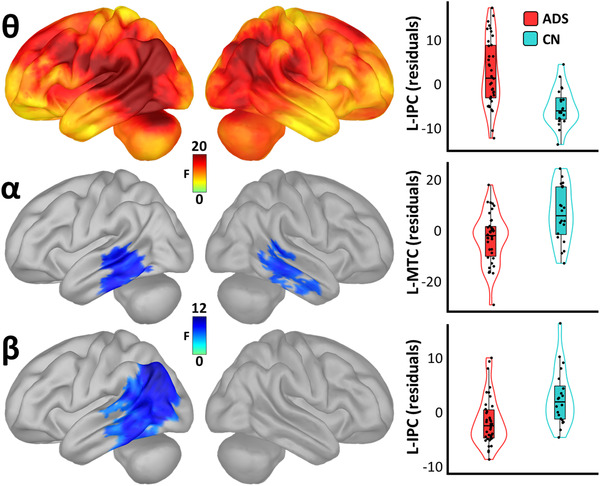
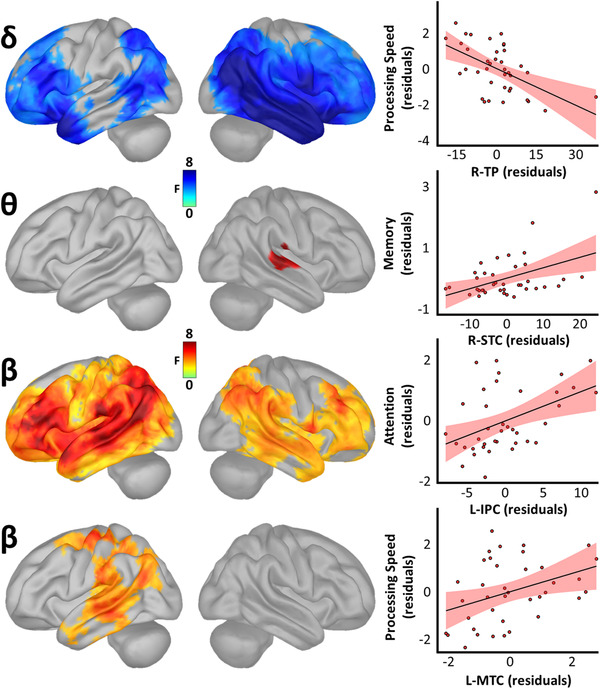
Results: By modeling whole-brain rhythmic neural activity with an extensive neuropsychological profile in patients on the AD spectrum, we show that the spectral and spatial features of deviations from healthy adults in neural population-level activity inform their relevance to domain-specific neurocognitive declines.

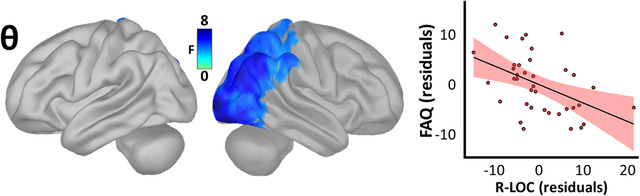
Discussion: Regional oscillatory activity represents a sensitive metric of neuronal pathology in patients on the AD spectrum. By considering not only the spatial, but also the spectral, definitions of cortical neuronal activity, we show that domain-specific cognitive declines can be better modeled in these individuals.

Keywords: neural oscillations; neuropsychology; resting‐state magnetoencephalography.


Conflict of interest statement

The authors declare no competing conflicts of interest, financial or otherwise.

Figures

FIGURE 1
FIGURE 1
Dynamic mapping of Alzheimer's pathology (DMAP) study flowchart. After initial screening and recruitment, participants performed an extensive series of neuropsychological tests designed to tap five cognitive domains: attention, memory, verbal function, processing speed, and learning. This testing visit was followed by another, neuroimaging‐focused visit, during which participants underwent functional and structural neuroimaging with MEG and MRI. Participants in the patient group returned for a third visit, in which they underwent a quantitative PET/CT scan with florbetapir 18F, and were excluded from further analysis at this stage if they were biomarker‐negative. Previous PET data was available for 19 CN adults. The cortical surface maps (bottom center) represent the grand average of these PET scans across all patients in the final (biomarker‐positive) AD spectrum group. Red text indicates protocols that only pertain to the AD spectrum group. Aβ, amyloid beta; ADS, Alzheimer's disease spectrum; CN, cognitively normal; HVLT‐R, Hopkins Verbal Learning Test‐Revised; MEG, magnetoencephalography; MMSE, Mini‐Mental State Examination; MoCA, Montreal Cognitive Assessment; MRI, magnetic resonance imaging; PET, positron emission tomography; WAIS‐IV, Wechsler Adult Intelligence Scale Fourth Edition; WMS‐IV LM, Wechsler Memory Scale Fourth Edition Logical Memory; WRAT‐4, Wide Range Achievement Test 4
FIGURE 2
FIGURE 2
Spatio‐spectral group differences in cortical neural oscillatory amplitude. Surface maps to the left indicate significant statistical differences in oscillatory amplitude between patients (Alzheimer's disease spectrum [ADS]) and cognitively normal older controls (CN), beyond the effects of age, and corrected for multiple comparisons using a stringent threshold‐free cluster enhancement approach (pFWE = .05). Theta maps are shown at the top, with alpha maps in the middle and beta maps at the bottom. Plots to the right of each map indicate the direction and nature of these effects at the vertices where they were most pronounced. Box plots represent conditional means, first and third quartiles, and minima and maxima, and violin plots show the probability density. L‐IPC, left inferior parietal cortex; L‐MTC, left middle temporal cortex
FIGURE 3
FIGURE 3
Spatio‐spectral neural oscillations predict cognitive decline along the Alzheimer's disease (AD) spectrum. Surface maps to the left indicate significant statistical outputs of whole‐brain models relating oscillatory amplitude and domain‐specific cognitive function in patients on the AD spectrum, beyond the effects of age, and corrected for multiple comparisons using a stringent threshold‐free cluster enhancement approach (pFWE = .05). Plots to the right of each map indicate the direction and nature of these effects at the vertices where they were most pronounced, with lines‐of‐best‐fit and corresponding confidence intervals overlaid. L‐IPC, left inferior parietal cortex; L‐MTC, left middle temporal cortex; R‐STC, right superior temporal cortex; R‐TP, right temporal pole
FIGURE 4
FIGURE 4
Spatio‐spectral neural oscillations predict functional independence along the Alzheimer's disease spectrum. The surface maps to the left indicate the significant statistical output of a whole‐brain model relating oscillatory amplitude and functional independence (instrumental activities of daily living) in patients on the AD spectrum, beyond the effects of age, and corrected for multiple comparisons using a stringent threshold‐free cluster enhancement approach (pFWE = .05). The plot to the right indicates the direction and nature of this effect at the vertex where it was most pronounced, with the line‐of‐best‐fit and corresponding confidence interval overlaid. FAQ, Functional Activities Questionnaire; R‐LOC, right lateral occipital cortex

References

    1. Jones DT, Knopman DS, Gunter JL, et al. Cascading network failure across the Alzheimer's disease spectrum. Brain. 2016;139(2):547‐562. - PMC - PubMed
    1. Aisen PS, Cummings J, Jack CR, et al. On the path to 2025: understanding the Alzheimer's disease continuum. Alzheimers Res Ther. 2017;9(1):60. - PMC - PubMed
    1. Collie A, Maruff P. The neuropsychology of preclinical Alzheimer's disease and mild cognitive impairment. Neurosci Biobehav Rev. 2000;24(3):365‐374. - PubMed
    1. Haworth J, Phillips M, Newson M, Rogers PJ, Torrens‐Burton A, Tales A. Measuring information processing speed in mild cognitive impairment: clinical versus research dichotomy. J Alzheimers Dis. 2016;51(1):263‐275. - PMC - PubMed
    1. Ewers M, Walsh C, Trojanowski JQ, et al. Prediction of conversion from mild cognitive impairment to Alzheimer's disease dementia based upon biomarkers and neuropsychological test performance. Neurobiol Aging. 2012;33(7):1203‐1214.e2. - PMC - PubMed