Review
. 2021 Apr 20:21:255-263.
doi: 10.1016/j.omto.2021.04.006. eCollection 2021 Jun 25.

Quantitative proteomics characterization of cancer biomarkers and treatment

Affiliations
Review

Quantitative proteomics characterization of cancer biomarkers and treatment

Xiao-Li Yang et al. Mol Ther Oncolytics. .

Abstract

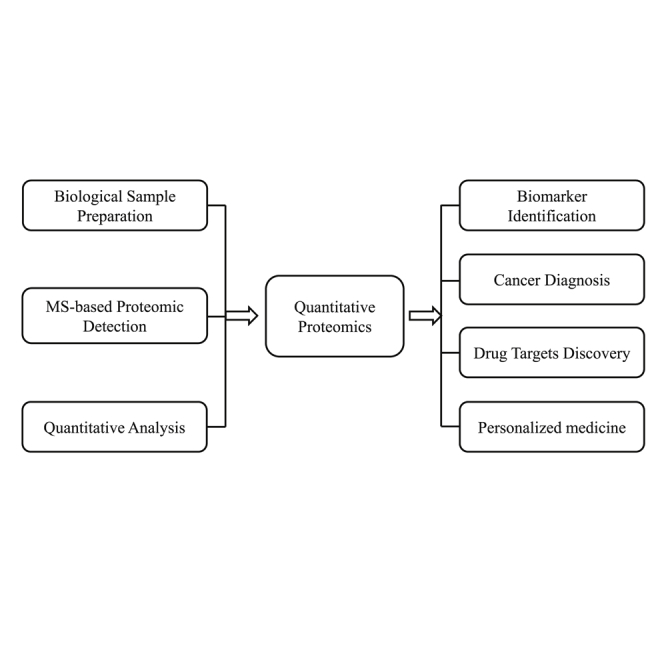
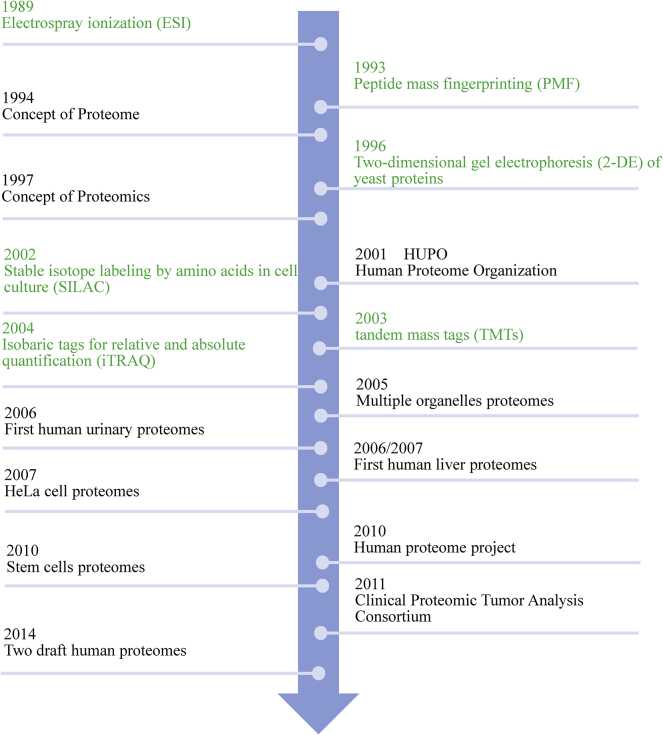
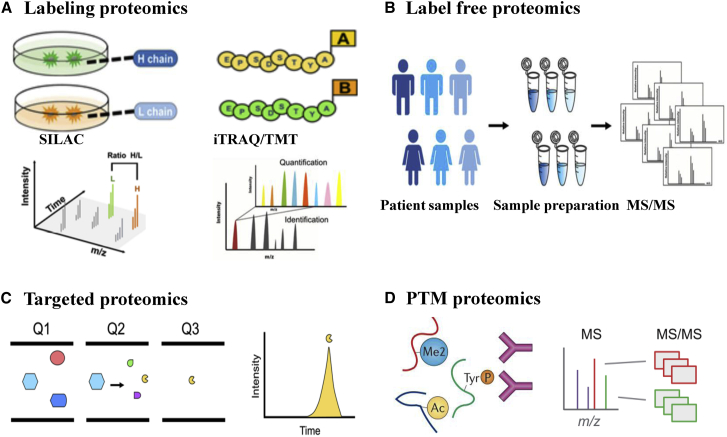
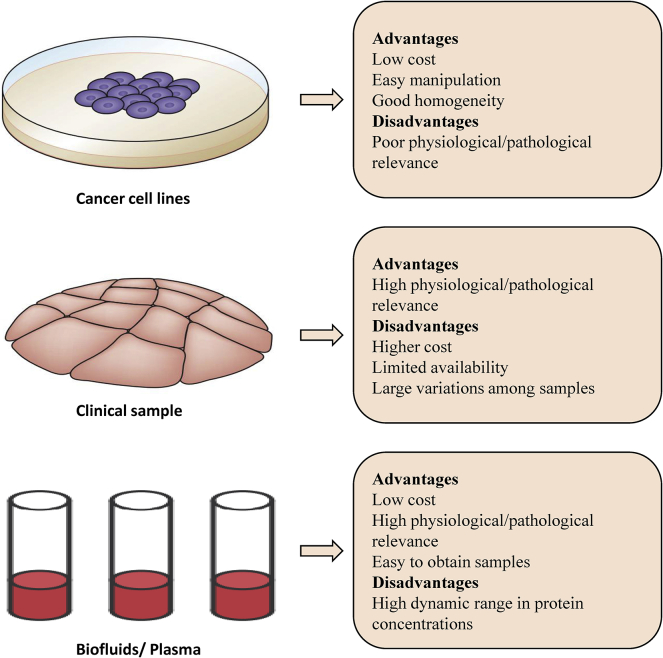
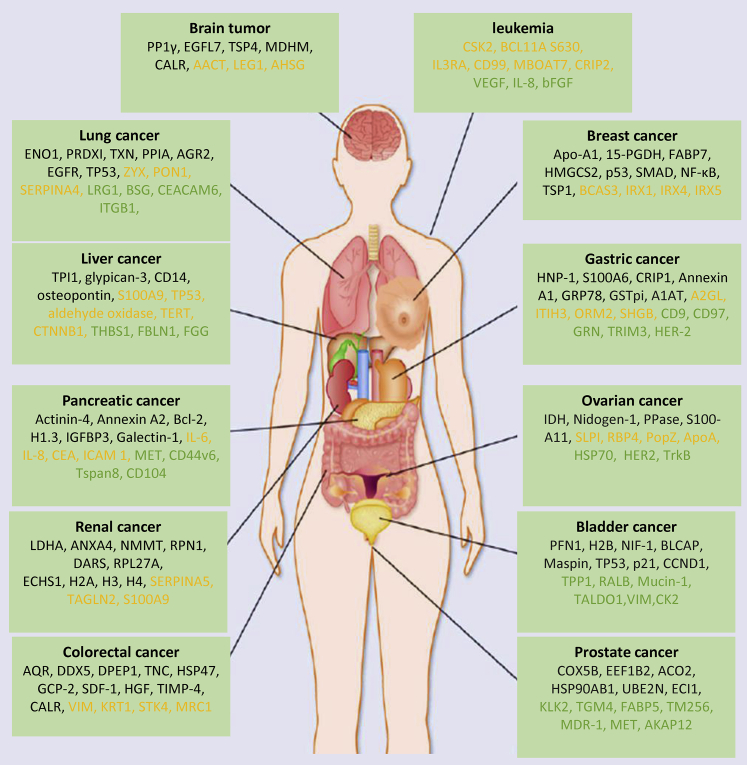
Cancer accounted for 16% of all death worldwide in 2018. Significant progress has been made in understanding tumor occurrence, progression, diagnosis, treatment, and prognosis at the molecular level. However, genomics changes cannot truly reflect the state of protein activity in the body due to the poor correlation between genes and proteins. Quantitative proteomics, capable of quantifying the relatively different protein abundance in cancer patients, has been increasingly adopted in cancer research. Quantitative proteomics has great application potentials, including cancer diagnosis, personalized therapeutic drug selection, real-time therapeutic effects and toxicity evaluation, prognosis and drug resistance evaluation, and new therapeutic target discovery. In this review, the development, testing samples, and detection methods of quantitative proteomics are introduced. The biomarkers identified by quantitative proteomics for clinical diagnosis, prognosis, and drug resistance are reviewed. The challenges and prospects of quantitative proteomics for personalized medicine are also discussed.

Keywords: biomarker; cancer; diagnostic marker; quantitative proteomics; therapeutic target.


Conflict of interest statement

The authors declare no competing interests.

Figures

None
Graphical abstract
Figure 1
Figure 1
The development of quantitative proteomics Green indicates technical MS advances; black indicates MS-identified human proteomes.
Figure 2
Figure 2
A comparison of detection methods used in quantitative proteomics (A) Labeling proteomics: SILAC is used for cell lines, iTRAQ/TMT is used for labeling in vitro, and MS/MS spectra are assigned to peptides for identification and quantitation. (B) Label-free proteomics is used to quantify the protein expression across different samples. (C) Targeted proteomics, selected from three quadrupoles (Q1, Q2, Q3), is suitable for identifying and quantitating target peptides within complex mixtures. (D) PTM proteomics: using antibody-based immunoprecipitation (IP) to enrich peptides containing modifications (phosphorylation [P], dimethyl [Me2], or acetylation [Ac]), LC-MS/MS is used for peptide identification and quantitation.
Figure 3
Figure 3
A comparison of the biological samples used in quantitative proteomics There are three samples for quantitative proteomics analysis, as shown on the left. Each type of sample has its advantages and disadvantages, as shown on the right.
Figure 4
Figure 4
Integrated view of LC-MS/MS proteomics workflow for cancer biomarker discovery Step 1: cancer tissues and adjacent tissues for protein extraction are prepared. Step 2: the proteins are enzymatically digested into peptides. Step 3: the peptides are analyzed with LC-MS/MS. Step 4: databases are mapped to peptides and proteins through quantification and filtering. Step 5: proteotype-like PPI interactomes are generated by further data validation. Step 6: candidate biomarkers and drug targets are identified. Step 7: after functional verification, biomarkers and drug targets are recommended to clinical medicine.
Figure 5
Figure 5
Quantitative proteomics adopted in the discovery of various cancer biomarkers Many biomarkers for different types of cancer are identified through quantitative proteomics. Biomarkers were found from cancer tissue (black), plasma/serum (orange), and exosome (green).

References

    1. Kristensen V.N., Lingjærde O.C., Russnes H.G., Vollan H.K., Frigessi A., Børresen-Dale A.L. Principles and methods of integrative genomic analyses in cancer. Nat. Rev. Cancer. 2014;14:299–313. - PubMed
    1. Borrebaeck C.A. Precision diagnostics: Moving towards protein biomarker signatures of clinical utility in cancer. Nat. Rev. Cancer. 2017;17:199–204. - PubMed
    1. Du R., Shen W., Liu Y., Gao W., Zhou W., Li J., Zhao S., Chen C., Chen Y., Liu Y. TGIF2 promotes the progression of lung adenocarcinoma by bridging EGFR/RAS/ERK signaling to cancer cell stemness. Signal Transduct. Target. Ther. 2019;4:60. - PMC - PubMed
    1. Min L., Zhu S., Wei R., Zhao Y., Liu S., Li P., Zhang S. Integrating SWATH-MS proteomics and transcriptome analysis identifies CHI3L1 as a plasma biomarker for early gastric cancer. Mol. Ther. Oncolytics. 2020;17:257–266. - PMC - PubMed
    1. Xu W., Xu M., Wang L., Zhou W., Xiang R., Shi Y., Zhang Y., Piao Y. Integrative analysis of DNA methylation and gene expression identified cervical cancer-specific diagnostic biomarkers. Signal Transduct. Target. Ther. 2019;4:55. - PMC - PubMed

LinkOut - more resources