. 2021 Apr 30;24(6):102490.
doi: 10.1016/j.isci.2021.102490. eCollection 2021 Jun 25.

Hydra vulgaris shows stable responses to thermal stimulation despite large changes in the number of neurons

Affiliations

Hydra vulgaris shows stable responses to thermal stimulation despite large changes in the number of neurons

Constantine N Tzouanas et al. iScience. .

Abstract

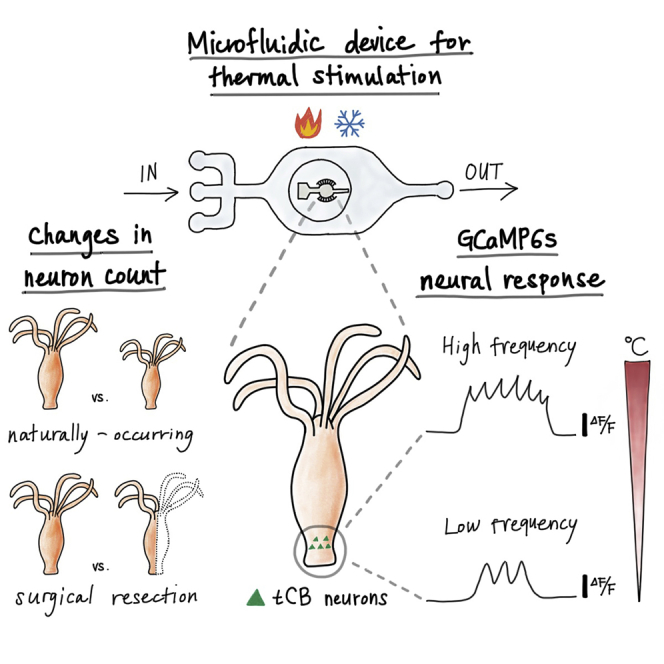
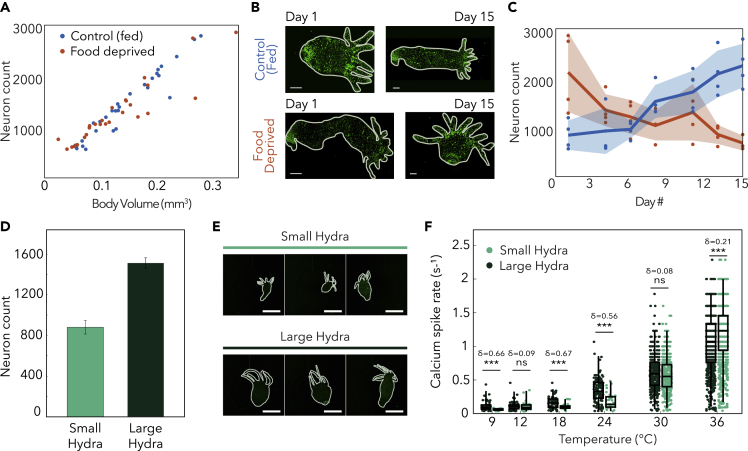
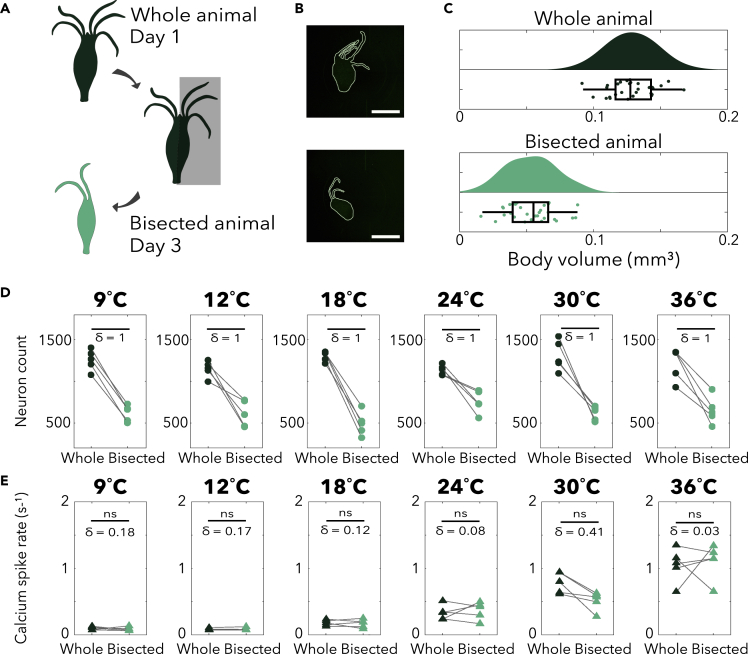
Many animals that lose neural tissue to injury or disease can maintain behavioral repertoires by regenerating new neurons or reorganizing existing neural circuits. However, most neuroscience small model organisms lack this high degree of neural plasticity. We show that Hydra vulgaris can maintain stable sensory-motor behaviors despite 2-fold changes in neuron count, due to naturally occurring size variation or surgical resection. Specifically, we find that both behavioral and neural responses to rapid temperature changes are maintained following these perturbations. We further describe possible mechanisms for the observed neural activity and argue that Hydra's radial symmetry may allow it to maintain stable behaviors when changes in the numbers of neurons do not selectively eliminate any specific neuronal cell type. These results suggest that Hydra provides a powerful model for studying how animals maintain stable sensory-motor responses within dynamic neural circuits and may lead to the development of general principles for injury-tolerant neural architectures.

Keywords: Behavioral neuroscience; Biological sciences; Developmental neuroscience; Neuroscience.


Conflict of interest statement

The authors declare no competing interests.

Figures

None
Graphical abstract
Figure 1
Figure 1
Characterization and validation of two-layer microfluidic device for thermal stimulation of Hydra vulgaris (A) (Left) Photograph of microfluidic device with blue dye in flow layer and green dye in Hydra chamber. Scale bar, 1 mm. (Middle) Schematic of cross-section of the device. (Right) Legend for left and middle panels. (B) Infrared image showing temperature of the flow layer before (leftmost), the start of (second leftmost), during (center), end of (second rightmost), and after (rightmost) thermal stimulation. (C) Time course of thermal stimulation at temperatures above and below Hydra's baseline culture temperature of 18°C.
Figure 2
Figure 2
Hydra's body length initially increases and width initially decreases when stimulated at 30°C (A) Schematic of a representative thermal stimulation protocol. Gray regions (I) indicate non-stimulus periods at Hydra's culture temperature lasting between 30 and 90 s, and blue-colored regions (II) indicate stimulus periods at designated temperatures for 60 s. (B) Representative frame annotated from DeepLabCut. Top panel describes which body points were annotated, and the bottom panel shows how the length and width of the animals are determined. The hypostome is the end of the body with Hydra's mouth and tentacles (oral end), whereas the basal disc is used to adhere to substrates (aboral end). Scale bar, 500 μm. (C) Average length and width of Hydra calculated for stimulation periods and time-aligned to stimuli, with 15 s before and after stimulation periods. Curve corresponds to mean, and shaded error bars correspond to standard error of the mean. N = 3 Hydra for No Flow, N = 6 Hydra for 18°C and 30°C. (D) The change in length (top panel) and width (bottom panel) at 20 s after onset of stimulation (t = 20 s), for each stimulus period. Box-and-whisker plots indicate Q1, median, and Q3; whisker lengths indicate the 2nd and 98th percentiles. N = 3 Hydra for No Flow, N = 6 Hydra for 18°C and 30°C. (n.s = not significant, ∗∗p < 0.001, ∗∗∗p < 0.0001, unpaired t test).
Figure 3
Figure 3
Thermal stimulation modulates the synchronous neural activity in the peduncle of Hydra vulgaris, see also Figures S1 and S2. (A) Schematic of a representative thermal stimulation protocol. Gray-colored regions (I) indicate non-stimulus periods at Hydra's culture temperature (either 18°C or 25°C) lasting between 30 and 90 s. The blue-colored regions (II) indicate stimulus periods at designated temperatures for 60 s. (B) Images of Hydra without synchronous neural firing (top) and during firing (bottom) in the peduncle (white circle). Scale bar, 1 mm. (C) Raster plot of synchronous firing events in peduncle in (B). One black vertical line indicates one synchronous firing event. Each row represents the raster plot of spikes time-aligned with one stimulation (boxed regions) with 30 s before and after stimulation (white non-boxed region). (D) Peristimulus time histogram (calcium firing rate) of (C), which was calculated with a 10-s sliding window. (E) Calcium spike rate comparison between the non-stimulation (gray-colored region I in A) and stimulation (blue-colored region II in A) periods with a stimulus temperature of 18°C. (ns = not significant, Mann-Whitney U test. δ = Effect size using Cliff's delta). Box-and-whisker plots indicate Q1, median, and Q3; whisker lengths indicate the 2nd and 98th percentiles. (F) Calcium spike rates from Hydra, all cultured at 18°C. N = 6 animals per stimulus temperature. (ns = not significant, ∗∗p < 0.0001, ∗∗∗p < 0.00001, Mann-Whitney U test. δ = Effect size using Cliff's delta). Box-and-whisker plots indicate Q1, median, and Q3; whisker lengths indicate the 2nd and 98th percentiles. (G) Calcium spike rates from Hydra cultured at 18°C and 25°C. x axis notes the stimulation temperatures. N = 3 per culture temperature at each stimulation temperature. (ns = not significant, ∗∗∗p < 0.00001, Mann-Whitney U test. δ = Effect size using Cliff's delta). Box-and-whisker plots indicate Q1, median, and Q3; whisker lengths indicate the 2nd and 98th percentiles.
Figure 4
Figure 4
Calcium spike rate of tCB neurons does not depend on Hydra's body size and number of neurons, see also Figure S3 (A) Number of neurons as a function of animal size (N = 4 per diet condition). (B) Fluorescence images of Hydra at days 1 and 15 for both control and food-deprived groups (pseudo colored). Scale bar, 200 μm. (C) Change in the number of neurons over the time course of 15 days. Curve corresponds to the mean, and shaded region corresponds to standard deviation. (D) Estimated number of neurons from measurements in (A). Data represented as mean ± standard error of the mean. (E) Three representative Hydra from small and large groups (pseudo colored). Scale bar, 1 mm. (F) Calcium spike rates from large (N = 3 per size at each temperature) and small (N = 3 per size at each temperature) Hydra, all cultured at 18°C. (ns = not significant, ∗∗∗p < 0.00001, Mann-Whitney U test. δ = Effect size using Cliff's delta). Box-and-whisker plots indicate Q1, median, and Q3; whisker lengths indicate the 2nd and 98th percentiles.
Figure 5
Figure 5
Changes in Hydra's number of neurons due to surgical resection do not affect neural response to thermal stimulation, see also Figure S4 (A) Experimental schematic. A whole animal is imaged on Day 1 and then surgically resected, producing the bisected animal that is imaged on Day 3 (48−50 h after being cut). (B) Representative image of whole Hydra (top panel), representative image of bisected Hydra (bottom panel). Scale bar, 1 mm. (C) Size distribution of whole and bisected Hydra. (N = 5 per size at each stimulation temperature). Box-and-whisker plots indicate Q1, median, and Q3; whisker lengths indicate the 2nd and 98th percentiles. (D) Comparison of neuron count between whole (N = 5 per size at each temperature) and bisected (N = 5 per size at each temperature) Hydra. The dark green data points on the left correspond to the number of neurons in the whole Hydra, which are connected to the corresponding bisected Hydra; the light green points on the right. δ, the effect size using Cliff's delta shown is calculated after bootstrapping with 100 iterations. (E) Mean calcium spike rate comparison between whole and bisected Hydra. (ns = not significant, Wilcoxon signed-rank test. δ = Effect size using Cliff's delta).

Similar articles

Cited by

References

    1. Alexopoulos H., Böttger A., Fischer S., Levin A., Wolf A., Fujisawa T., Hayakawa S., Gojobori T., Davies J.A., David C.N. Evolution of gap junctions: the missing link? Curr. Biol. 2004;14:R879–R880. - PubMed
    1. Alwes F., Enjolras C., Averof M. Live imaging reveals the progenitors and cell dynamics of limb regeneration. eLife. 2016;5:e19766. - PMC - PubMed
    1. Ayaz D., Leyssen M., Koch M., Yan J., Srahna M., Sheeba V., Fogle K.J., Holmes T.C., Hassan B.A. Axonal injury and regeneration in the adult brain of Drosophila. J. Neurosci. 2008;28:6010–6021. - PMC - PubMed
    1. Beckmann A. Molecular factors of nematocyst morphogenesis and discharge in the freshwater polyp Hydra. 2013. - DOI
    1. Binda F., Bossi E., Giovannardi S., Forlani G., Peres A. Temperature effects on the presteady-state and transport-associated currents of GABA cotransporter rGAT1. FEBS Lett. 2002;512:303–307. - PubMed

LinkOut - more resources