. 2021 Mar 11;3(2):fcab033.
doi: 10.1093/braincomms/fcab033. eCollection 2021.

Dravet syndrome-associated mutations in GABRA1, GABRB2 and GABRG2 define the genetic landscape of defects of GABAA receptors

Affiliations

Dravet syndrome-associated mutations in GABRA1, GABRB2 and GABRG2 define the genetic landscape of defects of GABAA receptors

Ciria C Hernandez et al. Brain Commun. .

Erratum in

Abstract

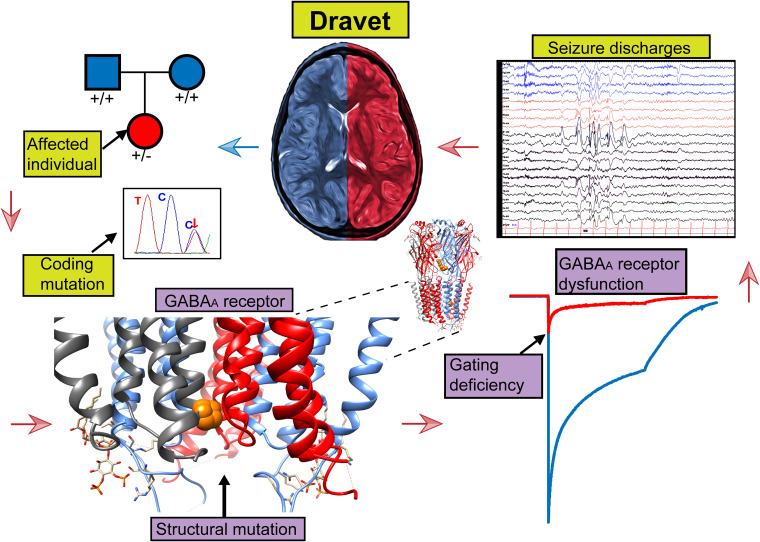
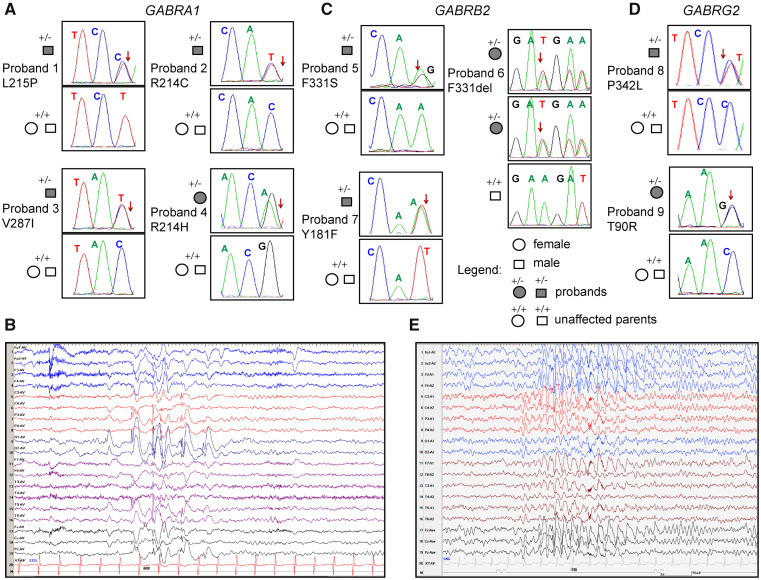
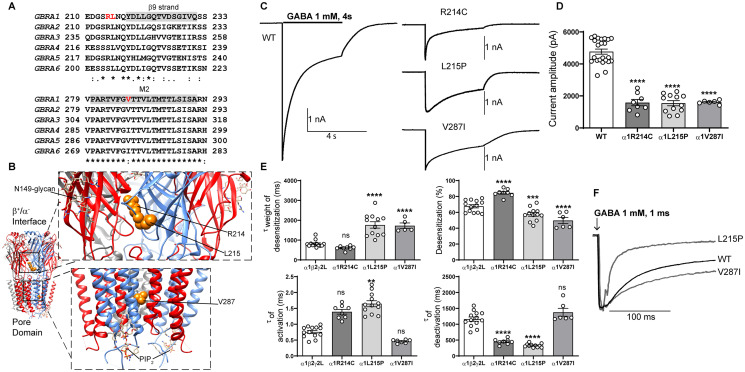
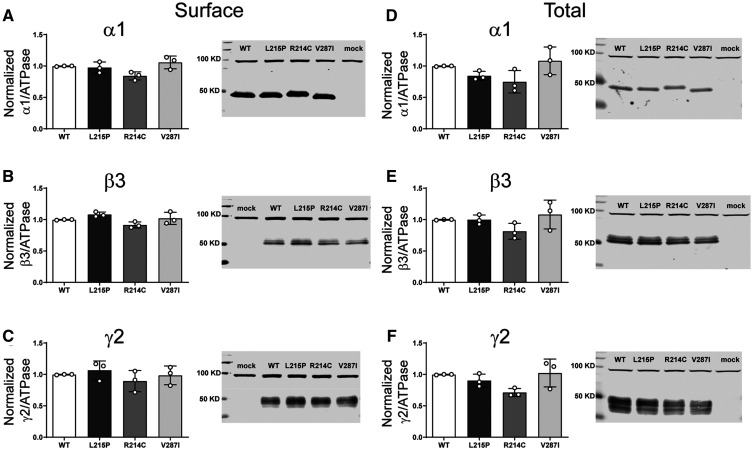
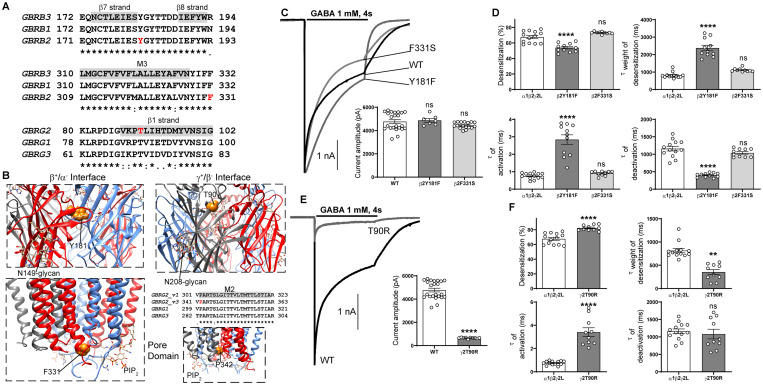
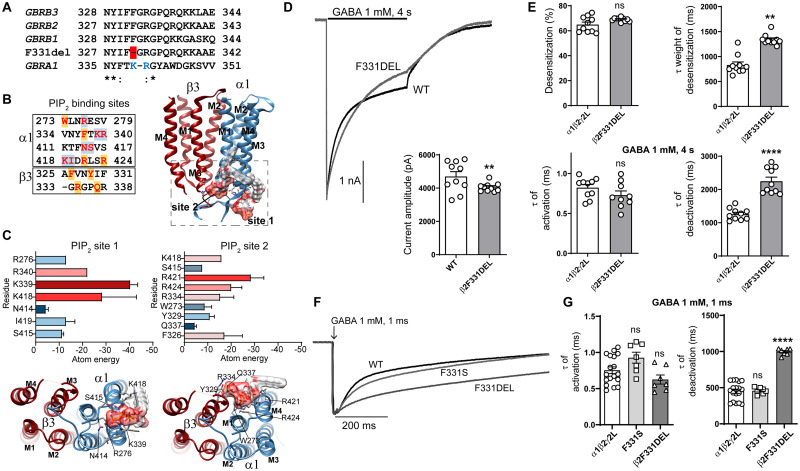
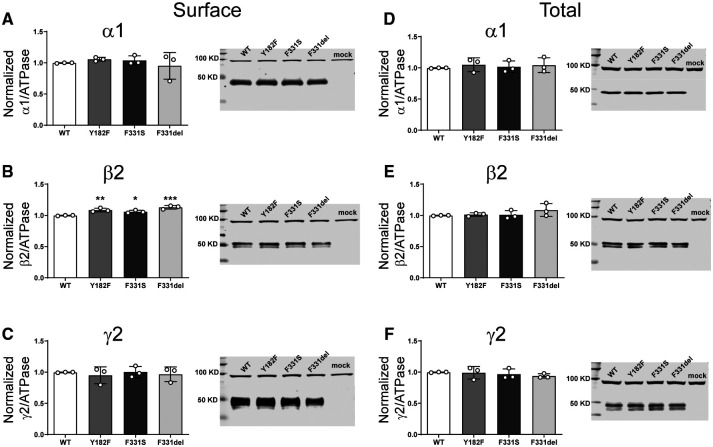
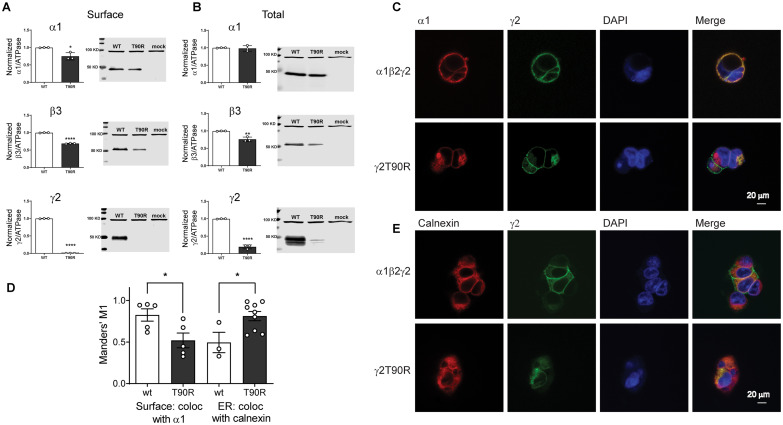
Dravet syndrome is a rare, catastrophic epileptic encephalopathy that begins in the first year of life, usually with febrile or afebrile hemiclonic or generalized tonic-clonic seizures followed by status epilepticus. De novo variants in genes that mediate synaptic transmission such as SCN1A and PCDH19 are often associated with Dravet syndrome. Recently, GABAA receptor subunit genes (GABRs) encoding α1 (GABRA1), β3 (GABRB3) and γ2 (GABRG2), but not β2 (GABRB2) or β1 (GABRB1), subunits are frequently associated with Dravet syndrome or Dravet syndrome-like phenotype. We performed next generation sequencing on 870 patients with Dravet syndrome and identified nine variants in three different GABRs. Interestingly, the variants were all in genes encoding the most common GABAA receptor, the α1β2γ2 receptor. Mutations in GABRA1 (c.644T>C, p. L215P; c.640C>T, p. R214C; c.859G>A; V287I; c.641G>A, p. R214H) and GABRG2 (c.269C>G, p. T90R; c.1025C>T, p. P342L) presented as de novo cases, while in GABRB2 two variants were de novo (c.992T>C, p. F331S; c.542A>T, p. Y181F) and one was autosomal dominant and inherited from the maternal side (c.990_992del, p.330_331del). We characterized the effects of these GABR variants on GABAA receptor biogenesis and channel function. We found that defects in receptor gating were the common deficiency of GABRA1 and GABRB2 Dravet syndrome variants, while mainly trafficking defects were found with the GABRG2 (c.269C>G, p. T90R) variant. It seems that variants in α1 and β2 subunits are less tolerated than in γ2 subunits, since variant α1 and β2 subunits express well but were functionally deficient. This suggests that all of these GABR variants are all targeting GABR genes that encode the assembled α1β2γ2 receptor, and regardless of which of the three subunits are mutated, variants in genes coding for α1, β2 and γ2 receptor subunits make them candidate causative genes in the pathogenesis of Dravet syndrome.

Keywords: Dravet syndrome-associated mutations; GABRA1; GABRB2; GABRG2; PIP2.


Figures

Graphical Abstract
Graphical Abstract
Figure 1
Figure 1
Dravet syndrome patient phenotypes. Pedigree and segregation analysis in nine Dravet syndrome patients of the nine GABR missense variants identified in (A)GABRA1, (C)GABRB2 and (D)GABRG2. Arrows indicate the position of the variant in the Sanger chromatograms of the affected probands. (B) Representative EEGs recorded during a seizure at 7 years of age of proband 1 showing high amplitude spike-wave discharges in the left occipital leads. (E) Representative EEG recorded during a seizure at 12 years of age of proband 9 showing generalized spike waves.
Figure 2
Figure 2
Electrophysiology and structural mapping of Dravet syndrome GABRA1 variants. (A) Alignment of human α1-6 GABAA receptor subunits. Positions of de novo variants in the α1 subunit are shown in red. Across all sequences, the residue L215 is identical (*), and the residue V287 is conserved (:). The β9-strand (highlighted in grey) and the transmembrane domain M2 (highlighted in grey) are represented across subunits above the alignments. (B) The cryo-EM structure of the human pentameric α1β3γ2L GABAA receptor was used for N-terminal and pore domain views (PDB 6HUO). Subunits α1 (blue), β3 (red) and γ2L (grey) are shown. The principal (+) and complementary (−) faces of α1, β3 and γ2 subunits and binding sites for N-linked glycans and phosphatidylinositol-4,5-bisphosphate (PIP2) are indicated. GABRA1 de novo variants are mapped onto the α1 subunit and represented in orange. (C) Representative GABA-evoked-current traces were obtained following rapid application of 1 mM GABA for 4s to lifted HEK293T cells expressing wt α1 or variant α1(R214C, L215P, V287I) subunit-containing α1β2γ2L GABAA receptors. (D) Peak amplitudes of wt α1 or variant α1(R214C, L215P, V287I)β3γ2L subunit-containing α1β2γ2L GABAA receptors. (E) Bar graphs are presented showing desensitization, activation and deactivation of α1β2γ2L GABAA receptors containing wt α1 or variant α1(R214C, L215P, V287I)β3γ2L subunits. (F) Representative normalized GABA-evoked current traces illustrate the differences in the deactivation rates of α1β2γ2L GABAA receptors containing wt α1 or variant α1(L215P, V287I) subunits currents after rapid application of 1 mM GABA for 1 ms. Data points represent the mean ± SEM from 5 to 23 different patched cells per experimental condition acquired in two different experimental sessions (Table 1). One-way ANOVA with Dunnett’s multiple comparisons test was used to determine significance relative to α1β2γ2L (WT). ****P < 0.0001, ***P < 0.001, **P < 0.01, and nsP > 0.05, respectively.
Figure 3
Figure 3
Surface and total expression of Dravet syndrome GABRA1 variants. Wt α1 or variant α1(L215P, R214C and V287I) subunits were coexpressed with β3 and γ2 subunits in HEK293T cells. Surface receptors were biotinylated and stained against anti-GABAA receptor (A) α1, (B) β3 and (C) γ2 subunits. Control loading was assayed using anti-ATPase antibodies. Total cell lysates were collected, analysed by SDS-PAGE and blotted by anti- (D) α1, (E) β3, (F) γ2 subunit and anti-ATPase antibodies for loading controls. Representative western blots were presented at the right of the panels. Band intensities of the α1, β3 and γ2 subunits were normalized to the ATPase signal. Mock refers to the transfection with an empty plasmid. Values reported are mean ± SEM (Supplementary Table 3). One-way ANOVA followed by Dunnett’s multiple comparison test was used to determine significance relative to α1β2γ2L (WT). No significance was shown (p > 0.05). Corresponding uncropped blots are available in the Supplementary data.
Figure 4
Figure 4
Electrophysiology and structural mapping of Dravet syndrome GABRB2 and GABRG2 variants. (A) Alignment of human β1-3 and γ1-3 GABAA receptor subunits and positions of de novo variants in the β2 and γ2 subunits are shown in red. The β2(Y181, F331) and γ2(T90) residues are identical (*) across all subunit sequences. The β7, β8 and β1-strands (highlighted in grey) and the transmembrane domain M3 (highlighted in grey) are represented above the alignments. (B) In the top panels, GABRB2 and GABRG2 de novo variants (in orange) are mapped onto the β (in red) and γ (in grey) subunits at the β/α and γ/β interfaces of the cryo-EM structure of the human pentameric α1β3γ2L GABAA receptor (PDB 6HUO). Proximity to binding sites for N-linked glycans and PIP2 are indicated. In the bottom left panel, the GABRB2 de novo variant F331 (in orange) is mapped onto the β (in red) subunit of the receptor. The bottom right panels show the alignment of the pore-lining residues of M2 of the γ subunits and the pore domain where the γ2_v3P342L subunit is located in the M2 domain (highlighted in grey) of the receptor. (C) Representative non-normalized currents from α1β2γ2L receptors containing wt β2 or variant β2(Y181F, F331S) subunits. Inset bar graphs to the right show the average peak current recorded from those cells. (D) Bar graphs comparing desensitization, activation and deactivation of α1β2γ2L receptor currents from GABAA receptors containing wt β2 or variant β2(Y181F, F331S) subunits. (E) Representative non-normalized α1β2γ2L receptor currents containing wt γ2 or variant γ2(T90R) subunits Inset bar graphs to the right show the average peak currents recorded from those cells. (F) Bar graphs comparing desensitization, activation and deactivation of α1β2γ2L receptor currents from GABAA receptors containing wt γ2 or variant γ2(T90R) subunits. Data points represent the mean ± SEM from 7 to 23 different patched cells per experimental condition acquired in two different experimental sessions (Table 1). One-way ANOVA with Dunnett’s multiple comparisons test and unpaired two-tailed Student's t test were used to determine significance relative to α1β2γ2L (WT). ****p < 0.0001, **p < 0.01, and nsp > 0.05, respectively.
Figure 5
Figure 5
Electrophysiology and structural mapping of Dravet syndrome GABRB2 F331del. (A) Alignments of the edge of M3 of the human β1-3subunits, the β2(F331del) and α1 subunits. The position of the deletion is shown in red, and the PIP2 binding site residues in blue as reported. (B) Left, amino acids predicted to be part of the network of interactions of PIP2 in both α1 and β3(F332del) subunits are displayed in red. Highlighted in blue is shown the predicted residues of being part of the binding site 1 of PIP2, and in orange, the residues predicted for the binding site 2 of PIP2. Right, TM domains of the β3(F332del)α1 dimer enclosed the two docking PIP2 binding sites. PIP2 is in molecular surface electrostatic representation. (C) Top left, relevant residues that contributed to the network of interactions at the binding site 1 of PIP2 are classified according to total atomic energy (Kcal/mol), the weakest binding being blue, and the strongest red. Bottom left, intracellular view of the binding site 1 of PIP2. Top right, relevant residues that contributed to the network of interactions at the binding site 2 of PIP2 are classified as indicated before. Bottom right, intracellular view of the binding site 2 of PIP2. (D) Representative GABA-evoked-current traces evoked by 1 mM GABA for 4 s to cells express α1β2γ2L receptors with wt β2 or variant β2(F331del) subunits. Bottom right show the average peak current recorded from those cells. (E) Bar graphs displaying the effects of wt and variant subunits on macroscopic kinetics of GABAA receptors evoked by 1 mM GABA for 4 s. (F) Representative normalized GABA-evoked currents from α1β2γ2L receptors containing wt β2 or variant β2(F331del, F331S) subunits illustrate the differences in the deactivation rates of wt and variant β2(F331del) and β2(F331S) receptor currents after rapid application of 1 mM GABA for 1 ms. (G) Comparison of the effects of wt and variant β2(F331del, F331S) subunits on macroscopic kinetics of GABAA receptors after rapid application of 1 mM GABA for 1 ms. Data points represent the mean ± SEM from 6 to 18 different patched cells per experimental condition acquired in two different experimental sessions (Table 1). One-way ANOVA with Dunnett’s multiple comparisons test and unpaired two-tailed Student's t test were used to determine significance relative to α1β2γ2L (WT). ****P < 0.0001, **P < 0.01, and nsP > 0.05, respectively.
Figure 6
Figure 6
Surface and total expression of Dravet Syndrome GABRB2 variants. Wt β2 or variant β2(F331del) subunits were coexpressed with α1 and γ2 subunits in HEK293T cells. Surface (A, B, C) and total expression (D, E, F) were assessed as shown in Fig. 3. Values reported are mean ± SEM (Supplementary Table 3). One-way ANOVA followed by Dunnett’s multiple comparison test was used to determine significance relative to wild type (WT). ***P < 0.001, **P < 0.01 and *P < 0.05, respectively. Corresponding uncropped blots are available in the Supplementary data.
Figure 7
Figure 7
The Dravet Syndrome GABRG2 T90R variant is mainly retained in the ER. Wt γ2 or variant γ2(T90R) subunits were coexpressed with α1 and β3 subunits in HEK293T cells. Surface (A) and total expression (B) were assessed as shown in Fig. 3. Values reported are mean ± SEM (Supplementary Table 3). Unpaired two-tailed Student's t test was used to determine significance relative to wild type (WT). ****P < 0.0001, **P < 0.01 and *P < 0.05, respectively. Corresponding uncropped blots are available in Supplementary data. (C, E) Confocal images of surface and intracellular immunofluorescence staining in HEK293 cells expressing α1β2γ2 wild type and variant γ2(T90R) receptors. Non-permeabilized cells were stained with antibodies against the α1 subunit (red) and the wt or variant γ2HA tag (green). The ER was visualized with anticalnexin antibody (red). DAPI nuclear counterstaining (blue) and the merge of the staining are shown as indicated. (D) Quantification of the colocalization of variant γ2L(T90R)HA subunits within the ER was measured using Manders’ coefficient M1. The Manders’ M1 indicated the fraction of γ2L subunits that colocalized on the surface or within the ER. Values reported are mean ± SEM (n = 3–9 experiments for each condition). Unpaired two-tailed Student's t test was used to determine significance relative to wild type (wt). *P < 0.05.

Similar articles

Cited by

References

    1. Berg AT, Berkovic SF, Brodie MJ, et al. Revised terminology and concepts for organization of seizures and epilepsies: Report of the ILAE Commission on Classification and Terminology, 2005-2009. Epilepsia. 2010;51(4):676–685. - PubMed
    1. Katsnelson A, Buzsaki G, Swann JW.. Catastrophic childhood epilepsy: A recent convergence of basic and clinical neuroscience. Sci Transl Med. 2014;6(262):262ps13. - PubMed
    1. Marini C, Scheffer IE, Nabbout R, et al. The genetics of Dravet syndrome. Epilepsia. 2011;52 (Suppl 2):24–29. - PubMed
    1. Wu YW, Sullivan J, McDaniel SS, et al. Incidence of Dravet syndrome in a US population. Pediatrics. 2015;136(5):e1310–e1315. - PMC - PubMed
    1. Symonds JD, Zuberi SM, Stewart K, et al. Incidence and phenotypes of childhood-onset genetic epilepsies: A prospective population-based national cohort. Brain. 2019;142(8):2303–2318. - PMC - PubMed

LinkOut - more resources