. 2021 Apr 30;2(5):100263.
doi: 10.1016/j.xcrm.2021.100263. eCollection 2021 May 18.

GIPR antagonist antibodies conjugated to GLP-1 peptide are bispecific molecules that decrease weight in obese mice and monkeys

Affiliations

GIPR antagonist antibodies conjugated to GLP-1 peptide are bispecific molecules that decrease weight in obese mice and monkeys

Shu-Chen Lu et al. Cell Rep Med. .

Abstract

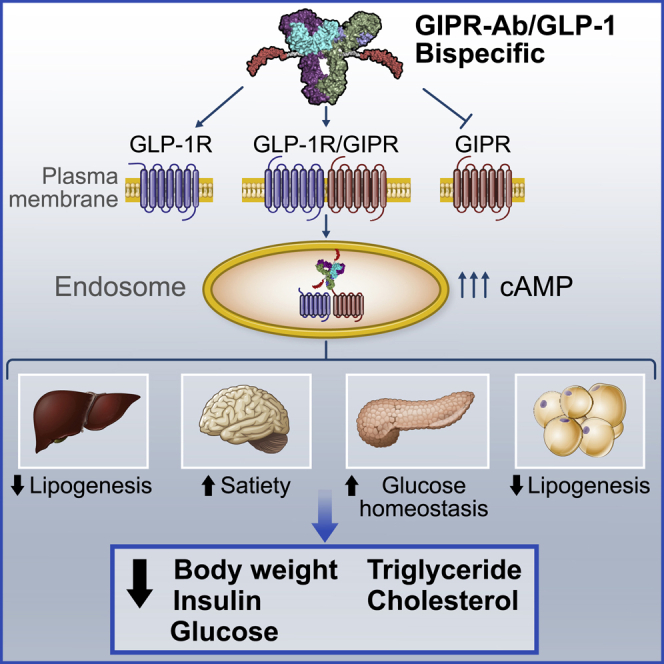
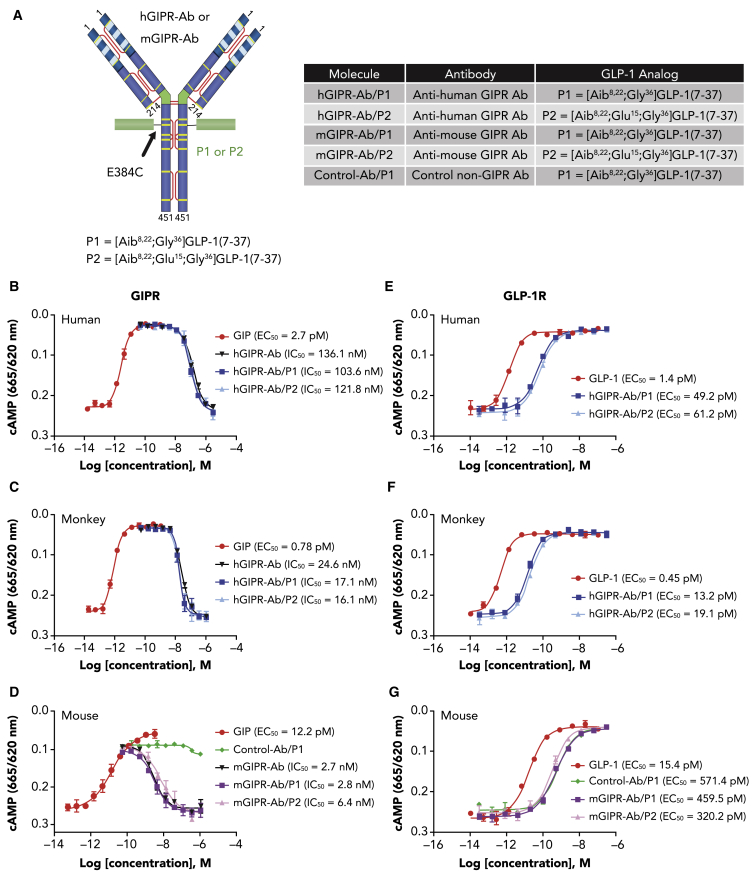
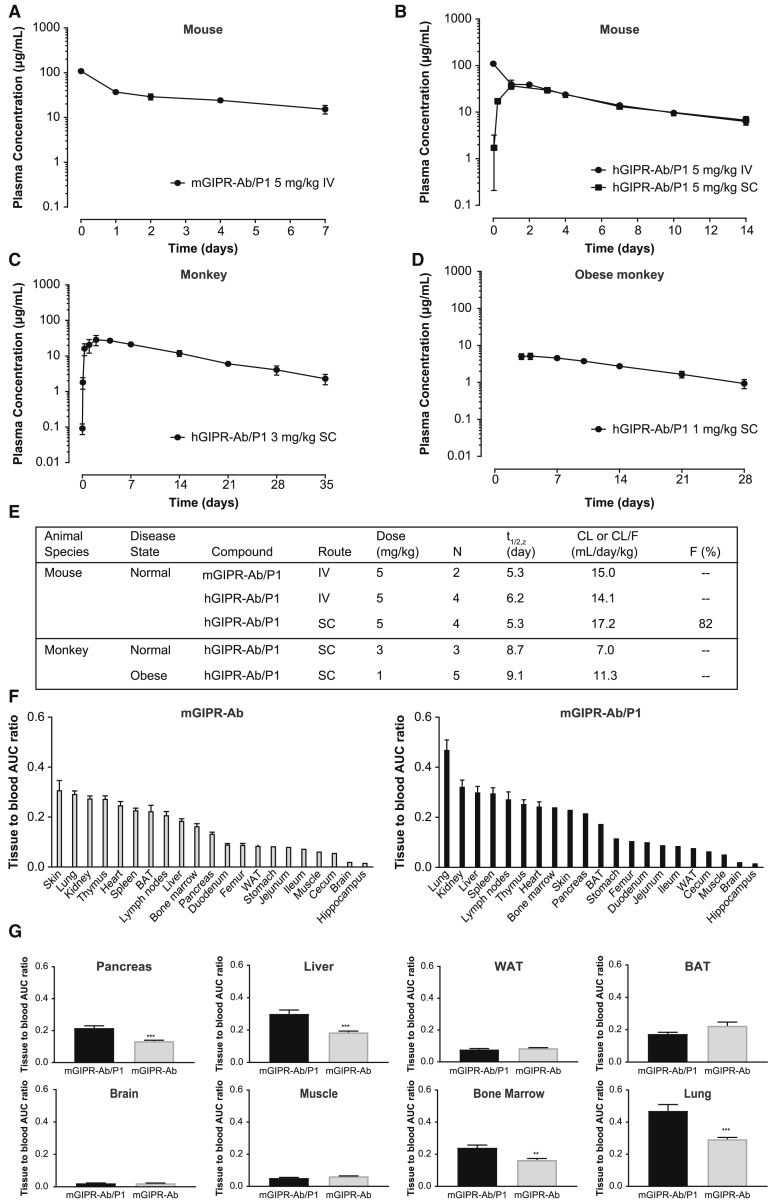
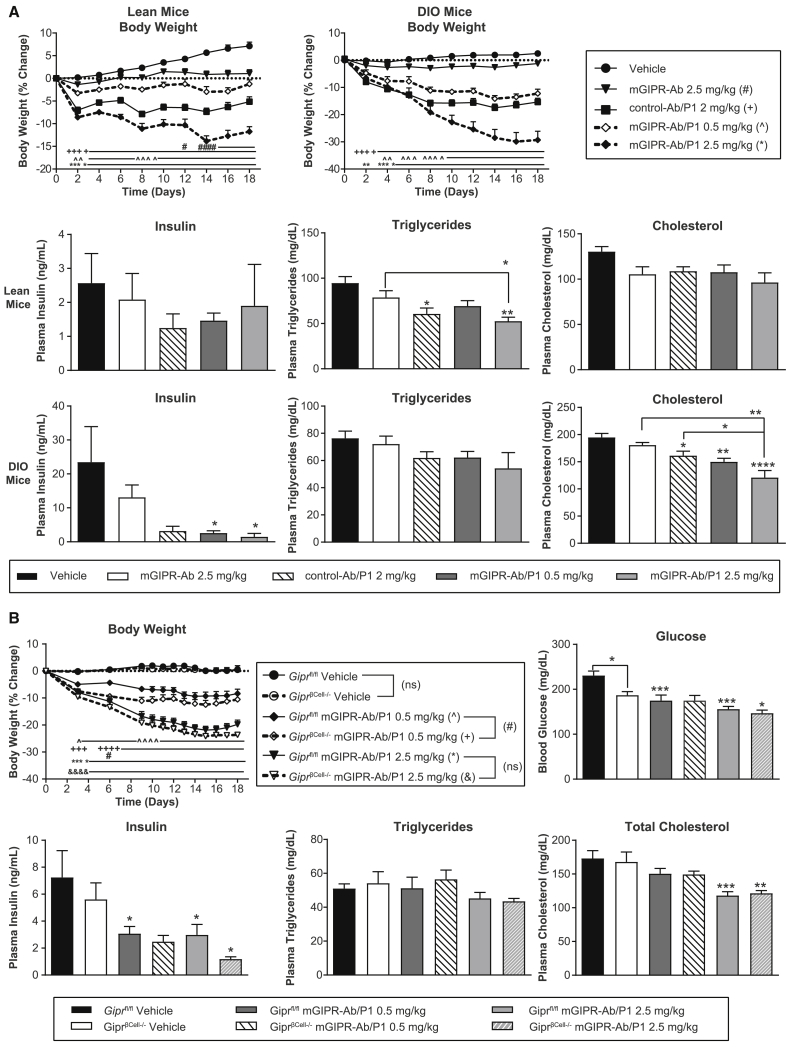
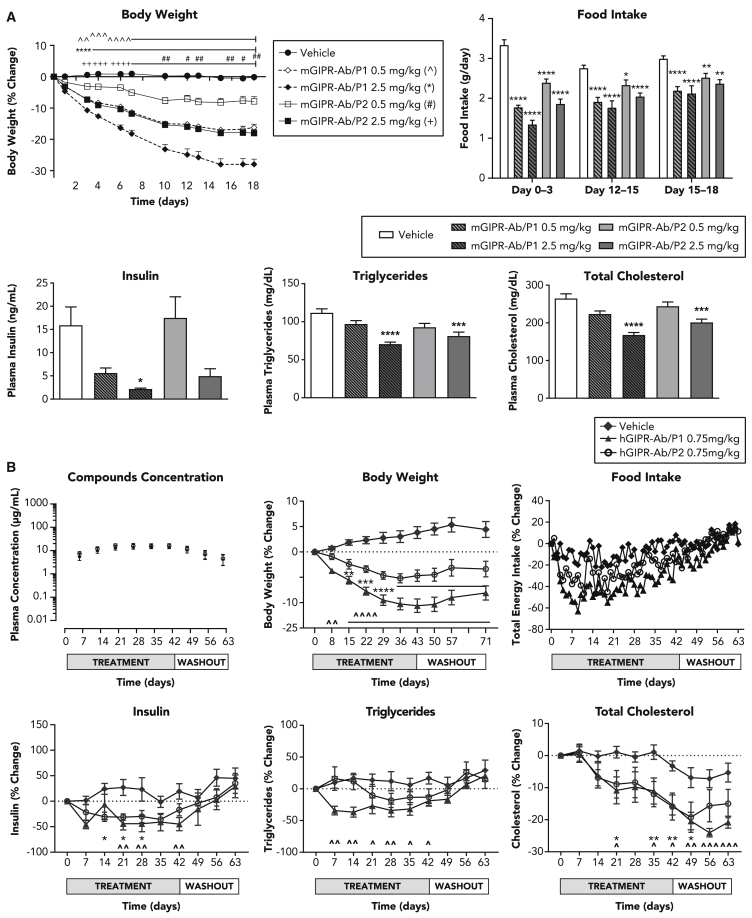
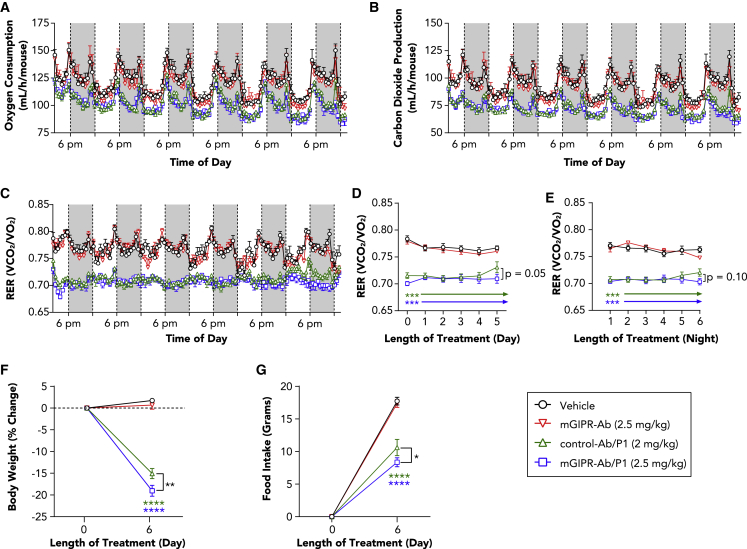
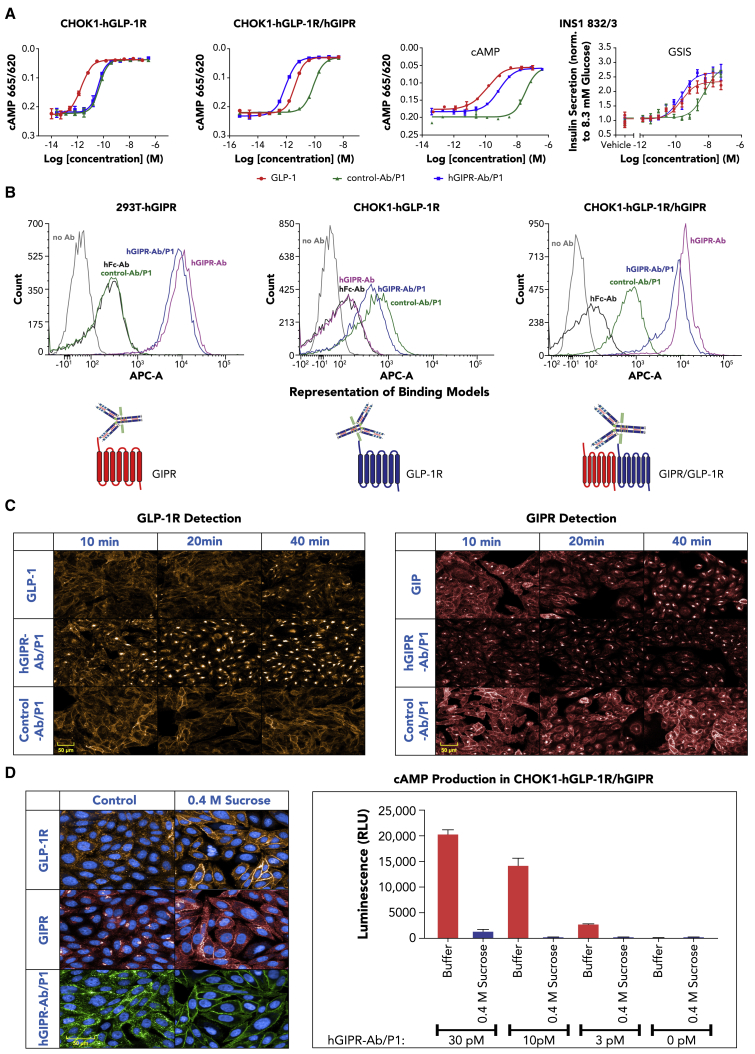
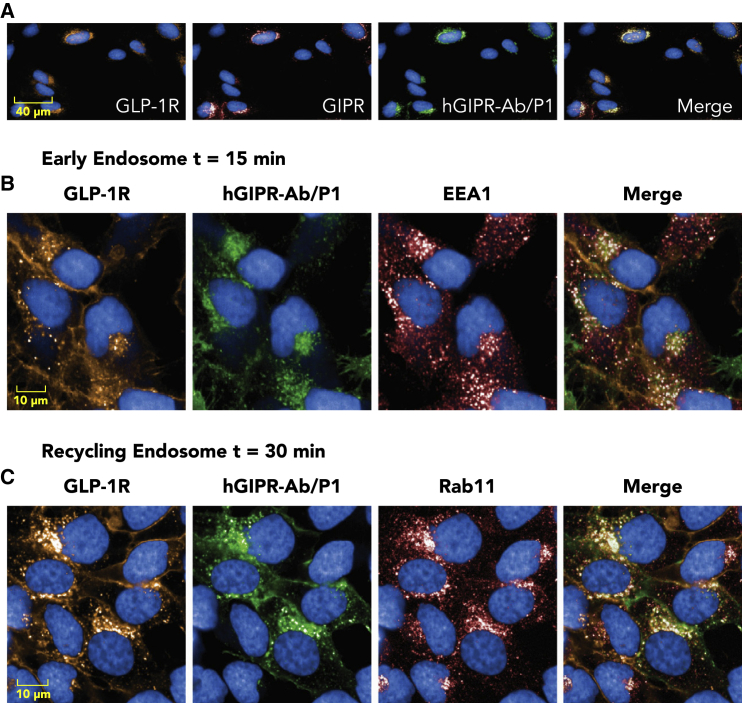
Glucose-dependent insulinotropic polypeptide (GIP) and glucagon-like peptide-1 (GLP-1) regulate glucose and energy homeostasis. Targeting both pathways with GIP receptor (GIPR) antagonist antibody (GIPR-Ab) and GLP-1 receptor (GLP-1R) agonist, by generating GIPR-Ab/GLP-1 bispecific molecules, is an approach for treating obesity and its comorbidities. In mice and monkeys, these molecules reduce body weight (BW) and improve many metabolic parameters. BW loss is greater with GIPR-Ab/GLP-1 than with GIPR-Ab or a control antibody conjugate, suggesting synergistic effects. GIPR-Ab/GLP-1 also reduces the respiratory exchange ratio in DIO mice. Simultaneous receptor binding and rapid receptor internalization by GIPR-Ab/GLP-1 amplify endosomal cAMP production in recombinant cells expressing both receptors. This may explain the efficacy of the bispecific molecules. Overall, our GIPR-Ab/GLP-1 molecules promote BW loss, and they may be used for treating obesity.

Keywords: Cyclic adenosine monophosphate; antibody; cAMP; diet-induced obese mice; glucagon-like peptide-1; glucose-dependent insulinotropic polypeptide; monkeys; obesity; weight loss.


Conflict of interest statement

The authors declare no competing interests. All authors are employees and shareholders of Amgen. A patent related to this work has been filed: International Application No. PCT/US18/13918.

Figures

None
Graphical abstract
Figure 1
Figure 1
GIPR-Ab/GLP-1 bispecific molecules exhibit GIPR antagonist and GLP-1R agonist activities in vitro (A) Structure and nomenclature of GIPR-Ab/GLP-1. (B–D) Representative dose-response curves of cAMP assays with GIP (agonist mode) or bispecific molecules + 50 pM GIP (antagonist mode) in cells expressing human (B), monkey (C), or mouse (D) GIPR. (E–G) Representative dose-response curves of cAMP assays with GLP-1 or bispecific molecules in cells expressing human (E), monkey (F), or mouse (G) GLP-1R. Data represent mean ± SEM of n = 2 replicates per treatment.
Figure 2
Figure 2
GIPR-Ab/GLP-1 bispecific molecules showed extended pharmacokinetic profiles and biodistribution of GIPR-Ab/GLP-1 (A) mGIPR-Ab/P1 PK in mice. Data represent mean ± SEM of plasma concentration-time profile after single i.v. administration at 5 mg/kg (n = 2). (B–D) hGIPR-Ab/P1 PK in mice (B), monkeys (C), or obese monkeys (D). Data represent mean ± SEM of plasma concentration-time profile after single i.e. (B) or s.c. (B–D) administration at 5 (B), 3 (C), or 1 (D) mg//kg (n = 3–5). (E) Summary of PK characteristics of mGIPR-Ab/P1 and hGIPR-Ab/P1. (F) Tissue to blood AUC ratio of mGIPR-Ab and mGIPR-Ab/P1. Data represent mean ± SEM, n = 3 mice per time point and 6 time points in total. (G) Tissue to blood AUC ratio side-by-side comparison in the pancreas, liver, WAT, BAT, brain, muscle, bone marrow, and lung. ∗∗p < 0.01, ∗∗∗p < 0.001 for mGIPR-Ab/P1 versus mGIPR-Ab. Data represent mean ± SEM, n = 3 mice per time point and 6 time points in total. See also Figure S1.
Figure 3
Figure 3
mGIPR-Ab/P1 dose-dependently reduced BW and showed greater effects on BW loss than mGIPR-Ab or control-Ab/P1 administered alone in lean and DIO mice, and the effects are independent of pancreatic β cells (A) BW percentage change was measured over time and terminal plasma insulin, triglycerides, and total cholesterol were measured in lean or DIO mice dosed with vehicle, mGIPR-Ab (2.5 mg/kg), control-Ab/P1 (2 mg/kg), and mGIPR-Ab/P1 (0.5 mg/kg and 2.5 mg/kg). n = 7 mice/group for lean and 7–8 mice/group for DIO, not all lean mice produced enough plasma for analysis (n = 4–6 mice/group for insulin, and n = 4–7 mice/group for triglycerides and cholesterol). Two-way repeated-measures ANOVA with Dunnett’s multiple comparisons for BW analysis and one-way ANOVA with Sidak’s test for multiple comparisons were done for glucose, insulin, triglycerides, and total cholesterol; #p < 0.05, ####p < 0.0001 vehicle versus mGIPR-Ab (2.5 mg/kg); ++++p < 0.0001 vehicle versus control-Ab/P1; ˆˆp < 0.001, ˆˆˆp < 0.001, ˆˆˆˆp < 0.0001 vehicle versus mGIPR-Ab/P1 (0.5 mg/kg); or ∗∗p < 0.01, ∗∗∗∗p < 0.0001 vehicle versus mGIPR-Ab/P1 (2.5 mg/kg); ∗p < 0.05, ∗∗p < 0.01, ∗∗∗p < 0.001, ∗∗∗∗p < 0.0001 treatment versus vehicle or between different groups as indicated in the graph with a bracket. (B) Giprfl/fl and GiprβCell−/− male littermates were fed HFD for 12 weeks and then IP dosed with the vehicle or mGIPR-Ab/P1 (0.5 mg/kg or 2.5 mg/kg) every 6 days for 18 days. BW percentage change was measured over time, and terminal blood glucose and plasma insulin, triglycerides, and total cholesterol were determined. n = 8 mice/group for all measurements and for triglycerides, n = 6–8 mice/group. For BW analysis, two-way repeated-measures ANOVA with Tukey’s HSD for multiple comparisons, ˆp < 0.05, ˆˆˆˆp < 0.0001 Giprfl/fl mGIPR-Ab/P1 (0.5 mg/kg) versus Giprfl/fl Vehicle; +++p < 0.001, ++++p < 0.0001 GiprβCell−/− mGIPR-Ab/P1 (0.5 mg/kg) versus GiprβCell−/− vehicle; #p < 0.05 Giprfl/fl mGIPR-Ab/P1 (0.5 mg/kg) versus GiprβCell−/− mGIPR-Ab/P1 (0.5 mg/kg); ∗∗∗∗p < 0.0001 Giprfl/fl mGIPR-Ab/P1 (2.5 mg/kg) versus Giprfl/fl vehicle; &&&&p < 0.0001 GiprβCell−/− mGIPR-Ab/P1 (2.5 mg/kg) versus GiprβCell−/− vehicle. For glucose, insulin, triglycerides, and total cholesterol, one-way ANOVA with Sidak’s test for multiple comparisons; ∗p < 0.05, ∗∗p < 0.001, ∗∗∗p < 0.0001 for treatment versus vehicle. See also Figure S2.
Figure 4
Figure 4
Chronic administration of GIPR-Ab/GLP-1 bispecific molecules reduced BW in obese monkeys (A) Dose response of mGIPR-Ab/P1 and mGIPR-Ab/P2 on BW, food intake, insulin, triglycerides, and total cholesterol in DIO mice. Statistical analysis was performed using GraphPad Prism V7.04. Two-way ANOVA with Tukey’s HSD for multiple comparisons was performed for BW (repeated-measures) and food intake data. One-way ANOVA with Sidak’s test for multiple comparisons was performed for all other parameters. For Figure 4A BW data, statistical significance is denoted as ˆˆp < 0.01, ˆˆˆp < 0.001, and ˆˆˆˆp < 0.0001 vehicle versus mGIPR-Ab/P1 (0.5 mg/kg); ∗∗∗∗p < 0.0001 vehicle versus mGIPR-Ab/P1 (2.5 mg/kg); #p < 0.05, and ##p < 0.01 vehicle versus mGIPR-Ab/P2 (0.5 mg/kg); 2+p < 0.01, +++p < 0.001, and ++++p < 0.0001 vehicle versus mGIPR-Ab/P2 (2.5 mg/kg). For food intake and metabolic parameters, statistical significance is denoted as ∗p < 0.05, ∗∗p < 0.01, ∗∗∗p < 0.001, and ∗∗∗∗p < 0.0001 versus vehicle. (B) Compounds exposure and the effects of hGIPR-Ab/P1 and hGIPR-Ab/P2 on BW, food intake, insulin, triglycerides, and total cholesterol in obese cynomolgus monkeys. All data are represented as group mean ± SEM. Two-way repeated-measures ANOVA with Dunnett’s multiple comparisons was performed using GraphPad Prism V7.04 and statistical significance is denoted as ˆp < 0.05, ˆˆp < 0.01, ˆˆˆp < 0.001, and ˆˆˆˆp < 0.0001 versus vehicle for hGIPR-Ab/P1 and ∗p < 0.05, ∗∗p < 0.01, ∗∗∗p < 0.001, and ∗∗∗∗p < 0.0001 versus vehicle for hGIPR-Ab/P2.
Figure 5
Figure 5
mGIPR-Ab/P1 prolonged reduction of light-cycle RER associated with enhanced BW loss and food intake reduction (A–C) DIO mice (23 weeks old) were dosed with vehicle, mGIPR-Ab (2.5 mg/kg), control-Ab/P1 (2 mg/kg), or mGIPR-Ab/P1 (2.5 mg/kg), and indirect calorimetry was conducted continuously for 6 days. (A) Oxygen consumption, (B) carbon dioxide production, and (C) RER measurements were taken continuously every 11 min. Each data point represents a rolling average of six time points, and dark cycles (6:00 p.m. to 6:00 a.m.) are shown by a shaded gray box. (D–G) RER (D) light-cycle and (E) dark-cycle measurement were averaged and displayed as mean ± SEM for each day or night over time, respectively. On day 6 (F), BW change and (G) food intake were measured. n = 5–6 mice/group; two-way repeated-measures ANOVA with Tukey’s HSD for multiple comparisons were performed. ∗p < 0.05, ∗∗p < 0.01, ∗∗∗p < 0.001, ∗∗∗∗p < 0.0001 vehicle versus treatment or mGIPR-Ab/P1 versus control-Ab/P1 indicated with bracket.
Figure 6
Figure 6
GIPR-Ab/GLP-1 molecules induced receptor internalization and amplified cAMP response in recombinant cells expressing GLP-1R and GIPR and in INS1 832/3 cells (A) Representative dose-response curves of cAMP assays and insulin secretion assay with GLP-1, control-Ab/P1, and hGIPR-Ab/P1 in cells expressing hGLP-1R or hGLP-1R/hGIPR or with GLP-1, control-Ab/P1, and mGIPR-Ab/P1 in INS1 832/3 cells. Data shown are representative of n ≥ 3 experiments. (B) FACS analysis of control human Fc antibody (hFc-Ab), hGIPR-Ab, control-Ab/P1, and hGIPR-Ab/P1 in cells expressing hGIPR, hGLP-1R, and hGLP-1R/hGIPR. The schematic figures represent the proposed receptor binding model for hGIPR-Ab/P1. Data represent mean ± SEM of n = 2 replicates per treatment. (C) Comparison of GLP-1, hGIPR-Ab/P1, and control-Ab/P1 induced hGLP-1R (orange-left) and hGIPR (red-right) receptor internalization in a CHOK1 cell line stably expressing both receptors. Cells were fixed, permeabilized, and stained at indicated time points after ligand (5 nM) stimulation. Image data shown are representative of n ≥ 3 experiments. (D) Pretreatment of CHOK1 cells expressing both hGLP-1R and hGIPR with 0.4 M sucrose for 15 min prevented hGIPR-Ab/P1 (5 nM) induced hGLP-1R (orange) and hGIPR (red) receptor and ligand (green) internalization (30 min time point shown) (left panel) and reduced cAMP production by >90% upon treatment at all concentrations of hGIPR-Ab/P1 tested (3, 10, 30 pM) at 15 min (right panel, ± SEM). Data shown are representative of n ≥ 3 experiments. See also Figure S7.
Figure 7
Figure 7
Co-localization of hGIPR-Ab/P1 with hGLP-1R and hGIPR receptors and with early and recycling endosome markers U2OS cells stably expressing SNAP-tagged hGLP-1R and hGIPR were fixed and permeabilized at indicated time points after hGIPR-Ab/P1 stimulation. (A) hGIPR-Ab/P1 (green) co-localized with hGLP-1R (orange) and hGIPR (red) in dual receptor-expressing cells (30 min after stimulation). (B) hGIPR-Ab/P1 (green) co-localized with hGLP-1R (orange) and EEA1 (red), an early endosome marker. (C) hGIPR-Ab/P1 (green) co-localized with hGLP-1R (orange) and Rab11 (red), a perinuclear recycling endosome marker. Data shown are representative of n ≥ 3 experiments.

Comment in

Similar articles

Cited by

References

    1. Finkelstein E.A., Trogdon J.G., Cohen J.W., Dietz W. Annual medical spending attributable to obesity: payer-and service-specific estimates. Health Aff. (Millwood) 2009;28:w822–w831. - PubMed
    1. Valsamakis G., Konstantakou P., Mastorakos G. New targets for drug treatment of obesity. Annu. Rev. Pharmacol. Toxicol. 2017;57:585–605. - PubMed
    1. Prasad-Reddy L., Isaacs D. A clinical review of GLP-1 receptor agonists: efficacy and safety in diabetes and beyond. Drugs Context. 2015;4:212283. - PMC - PubMed
    1. Drucker D.J. The biology of incretin hormones. Cell Metab. 2006;3:153–165. - PubMed
    1. Inagaki N., Seino Y., Takeda J., Yano H., Yamada Y., Bell G.I., Eddy R.L., Fukushima Y., Byers M.G., Shows T.B. Gastric inhibitory polypeptide: structure and chromosomal localization of the human gene. Mol. Endocrinol. 1989;3:1014–1021. - PubMed

Publication types

MeSH terms

Substances