. 2021 May 7;2(5):100267.
doi: 10.1016/j.xcrm.2021.100267. eCollection 2021 May 18.

Cabozantinib and dasatinib synergize to induce tumor regression in non-clear cell renal cell carcinoma

Affiliations

Cabozantinib and dasatinib synergize to induce tumor regression in non-clear cell renal cell carcinoma

Hui-Wen Lue et al. Cell Rep Med. .

Abstract

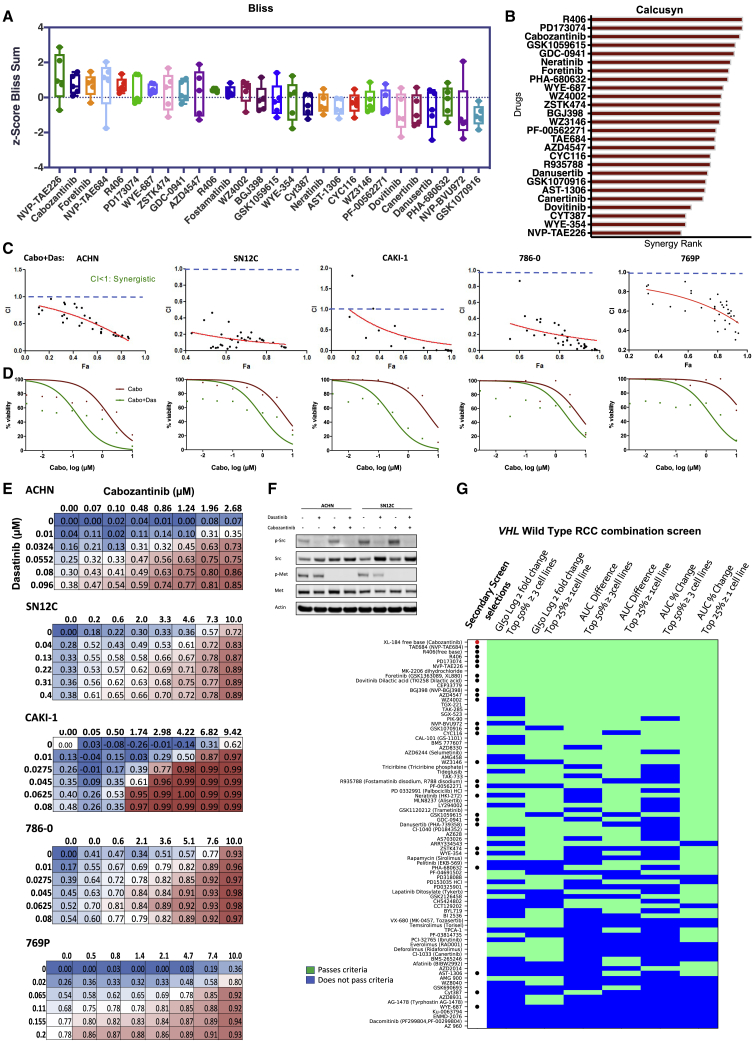
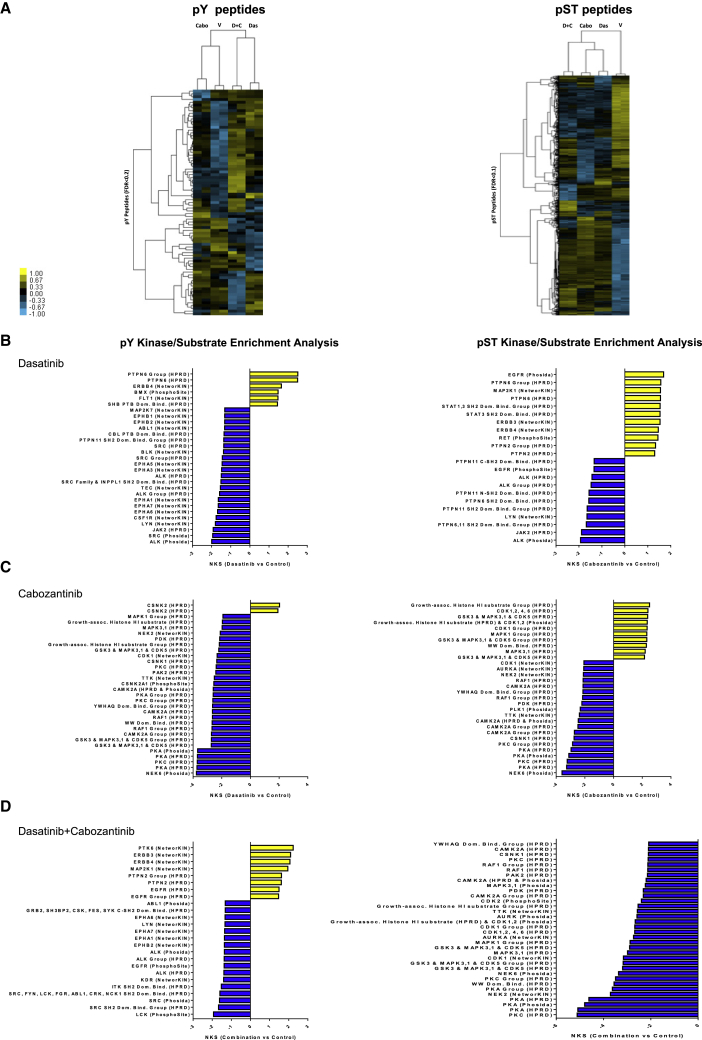
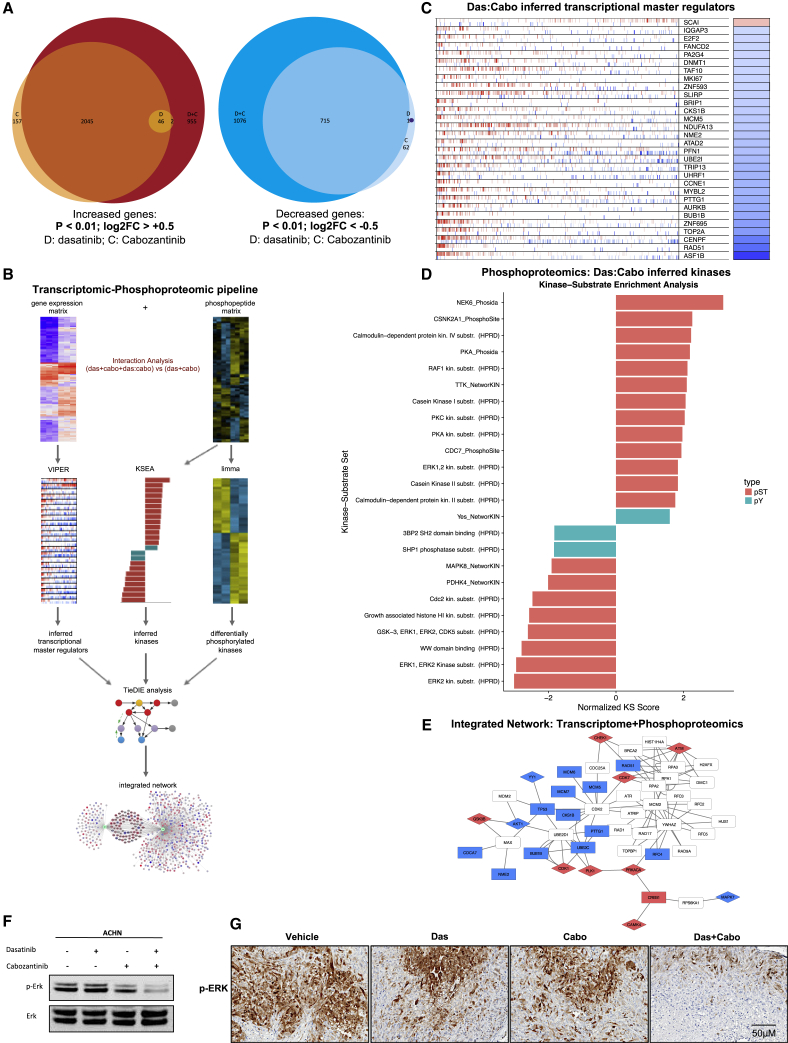
The lack of effective treatment options for advanced non-clear cell renal cell carcinoma (NCCRCC) is a critical unmet clinical need. Applying a high-throughput drug screen to multiple human kidney cancer cells, we identify the combination of the VEGFR-MET inhibitor cabozantinib and the SRC inhibitor dasatinib acts synergistically in cells to markedly reduce cell viability. Importantly, the combination is well tolerated and causes tumor regression in vivo. Transcriptional and phosphoproteomic profiling reveals that the combination converges to downregulate the MAPK-ERK signaling pathway, a result not predicted by single-agent analysis alone. Correspondingly, the addition of a MEK inhibitor synergizes with either dasatinib or cabozantinib to increase its efficacy. This study, by using approved, clinically relevant drugs, provides the rationale for the design of effective combination treatments in NCCRCC that can be rapidly translated to the clinic.

Keywords: MEK; SRC; VEGFR; cabozantinib; cobimetinib; combination therapies; dasatinib; high throughput screen; kidney cancer; non-clear cell renal cell carcinoma.


Conflict of interest statement

The authors declare no competing interests.

Figures

None
Graphical abstract
Figure 1
Figure 1
High-throughput drug combination drug screen to identify sensitizers to SRC inhibition in human kidney cancer cells (A) Schematic of the screen workflow: details of the primary screen with 292 drugs ± dasatinib in 8 cell lines are in Figure S1 and Table S1. See Results for additional details. (B) Heatmap of the combination screen of 81 drugs depicting the relative sensitivity of human kidney cancer cells (n = 8: VHL wild type: ACHN, SN12C, TK-10, UO-31, CAKI-1; VHL Null: 786-0, 769P, A498). The drugs shown passed the “highest single agent” (HSA) filter, where the combination needs to have at least 10% greater inhibition than either dasatinib or the drug alone at the same dose, for at least 3 doses. Each row depicts the response of a drug according to 3 different measurements: G150 fold change (columns 1 and 2), AUC difference between drug alone and drug+dasatinib (columns 3 and 4), and AUC percent change between drug alone and drug+dasatinib (columns 5 and 6). For each criterion, drugs pass (green) or do not pass (blue) 2 thresholds. In the first threshold, the measurement of the drug appears in the top 50% of all measurements in >4 cell lines (odd columns). In the second threshold, the drug measurement appears in the top 25% of all measurements in >1 cell line (even columns). Drugs selected for the secondary screen are denoted with a dot, with cabozantinib labeled with a red dot. (C–J) Scatterplots denote the fold change of drug+dasatinib AUC to drug alone AUC (x axis) versus the drug+dasatinib AUC Z score (y axis) for every drug. The red diamond indicates cabozantinib; the dark blue dots indicate drugs selected for the secondary screen; the remaining dots indicate the drugs that pass the HSA filter but were not in the secondary screen. Horizontal dashed line indicates the mean AUC Z score of 0, and the vertical dashed line indicates the AUC fold change of 1 (denoting that the drug+dasatinib AUC and the drug alone AUC are the same); (C) ACHN, (D) CAKI-1, (E) 786-0, (F) SN12C, (G) 769-P, (H) A498, (I) TK10, and (J) UO-31.
Figure 2
Figure 2
Validation of cabozantinib-dasatinib combination across representative RCC cells (A–C) Dose matrices for 5 human RCC cell lines, ACHN, CAKI-1, SN12C, 786-0, and 769-P, were generated in a 6 × 8 format (6 doses of dasatinib and 8 doses of the drug), assessed for viability after 4 days of treatment, and subjected to the estimation of synergy using the Bliss Independence Model and CalcuSyn. (A) Positive Bliss scores indicate combination effects, in which the effect is greater than additive. (B) CalcuSyn calculates the combination index (CI) for drug combinations: CI < 1 is synergistic, CI = 1 additive, and CI > 1 is antagonistic effects. The response of each cell line to the combination was analyzed for synergy and ranked by the number of combinations that were synergistic (see Method details). (C) CI for the cabozantinib+dasatinib combination in ACHN, SN12C, CAKI-1, 786-0, and 769P cells. (D) Cell viability was assessed by CellTiter-Glo in ACHN, SN12C, CAKI-1, 786-0, and 769P human kidney cancer cells treated with escalating doses of cabozantinib alone (red line) or cabozantinib and a fixed dose of dasatinib at its IC25 for ACHN, SN12C, CAKI-1, 786-0, and 789P (green line). The best-fit line represents the variable slope (log(inhibitor) versus response). (E) Secondary screening dose matrix of cabozantinib and dasatinib in ACHN, SN12C, CAKI-1, 786-0, and 769P human kidney cancer cells. Viability was assessed after 4 days. Percent inhibition at each dose of the drug is presented. (F) ACHN and SN12C human kidney cancer cells were seeded and treated with either dasatinib (50 nM) or cabozantinib (10 μM), either alone or in combination. Lysates were made after 24 h of treatment and probed with the indicated antibodies. (G) Heatmap of the combination screen of 81 drugs depicting the relative sensitivity of VHL WT human kidney cancer cells (n = 5; ACHN, SN12C, TK-10, UO-31, and CAKI-1).
Figure 3
Figure 3
Cabozantinib combines with dasatinib to induce tumor regression (A–D) ACHN xenografts treated with vehicle, dasatinib (das: 25 mg/kg/day), cabozantinib (cabo: 30 mg/kg/day) and dasatinib+cabozantinib (das+cabo: 25 mg/kg/day+30 mg/kg/day) combination. (A) Waterfall representation of response of each tumor after 15 days of treatment is shown. (B) Tumor volume is shown. Error bars represent mean ± SEM; (n > 8 per treatment group; control versus cabo+das ∗∗∗∗p < 0.0001). (C and D) Effect on apoptosis (c-C3) (C) and (D) proliferation (Ki-67) in ACHN xenograft tumors. Error bars represent means ± SEMs (C: control versus cabo+das, ∗∗∗∗p < 0.0001; das versus cabo+das, ∗∗∗∗p < 0.0001; cabo versus cabo+das ∗∗∗∗p < 0.0001). (D: control versus cabo+das, ∗∗∗∗p < 0.0001; das versus cabo+das, ∗∗∗∗p < 0.0001; cabo versus cabo+das ∗∗∗∗p < 0.0001). (E–H) CAKI-1 xenografts treated with vehicle, dasatinib (das: 35 mg/kg/day), cabozantinib (cabo: 10 mg/kg/day), and dasatinib+cabozantinib (das+cabo: 35 mg/kg + 10 mg/kg/day) combination. (E) Waterfall representation of response of each tumor after 15 days of treatment is shown. (F) Tumor volume is shown. Error bars represent means ± SEMs (n > 8 per treatment group; control versus cabo+das ∗∗∗∗p < 0.0001). (G and H) Effect on apoptosis (c-C3) (G) and (H) proliferation (Ki-67) in CAKI-1 xenograft tumors. Error bars represent means ± SEMs (G: control versus cabo+das, p = 0.0002∗∗∗∗; das versus cabo+das, p < 0.0006∗∗∗; cabo versus cabo+das, ns) (H: control versus cabo+das, p < 0.0001∗∗∗∗; das versus cabo+das, p < 0.0001∗∗∗∗; cabo versusv cabo+das p < 0.0001 ∗∗∗∗). (I) Representative images of tumor tissue from ACHN xenografts treated with the indicated drug regimens were evaluated by immunohistochemistry for cleaved caspase 3 and Ki-67. (J) Representative images of tumor tissue from ACHN xenografts treated with the indicated drug regimens were evaluated by immunofluorescence for p-MET and p-SRC.
Figure 4
Figure 4
Characterization of the phosphoproteome in cabozantinib-dasatinib co-treated NCCRCC cells (A) Supervised hierarchical clustering heatmaps of phosphotyrosine peptides (pY, left panel), and phosphoserine and phosphothreonine peptides (pST, right) and identified from cabozantinib, dasatinib, and the combination in treated and untreated ACHN human RCC cells with 2 technical replicates. A total of 81 unique pY phosphopeptides (rows) and 3,369 unique pST phosphopeptides were either 4-fold more enriched or 4-fold less enriched, on average (pY: FDR < 0.2; pST: FDR < 0.1; t test p < 0.2), in combination-treated cells compared to untreated cells. (B–D) Kinase-substrate enrichment analysis (KSEA) of (B) dasatinib, (C) cabozantinib, (D) cabozantinib-dasatinib co-treated and untreated pY (hits ≥ 3; FDR < 0.05; left panels), and pST data (hits ≥ 30; FDR < 0.01; right panels). Positive NKS (normalized Kolmogorov-Smirnov score) infers greater kinase activity in cabozantinib-dasatinib co-treated cells, while negative NKS indicates greater activity in untreated cells (unfiltered summary is in Table S2).
Figure 5
Figure 5
Cabozantinib and dasatinib converge to downregulate the MAPK-ERK signaling pathway (A) RNA: ACHN cells were treated with 50 nM dasatinib (D), 10 μM cabozantinib (C), or the combination (D+C) for 24 h. Differentially expressed genes induced by single or combination drug treatment. Euler diagrams show overlaps in genes with significant increase (log2FC ≥ 0.5; FDR-corrected p ≤ 0.01; left panel) or decrease (log2FC ≤ −0.5; FDR-corrected p ≤ 0.01; right panel) in expression following individual or combination drug treatment. (B) Transcriptomic-phosphoproteomic data integration workflow: to identify genes and phosphopeptides selectively affected by the cabozantinib-dasatinib drug interaction, we compared full models, including terms for the individual drugs and their interaction, to reduced models that only model the individual drug effects. Genes and phosphopeptides were then ranked by the extent to which their expression was better explained by inclusion of an interaction term. Using these ranked lists, we used the VIPER algorithm to infer master regulator activity from transcriptional profiling data, and we used the KSEA algorithm to infer upstream kinase activity from the phosphoproteomic data. The TieDie algorithm was used with the Multinet interaction network to combine inferred transcriptional master regulators, inferred kinases, and directly measured kinases into an integrated network associated with response to the combination drug treatment. (C) Inferred master regulators induced by cabozantinib-dasatinib combination: RNA: transcriptional master regulators driving the unique response to combination treatment were inferred from genes ranked by the interaction coefficient using VIPER. Hashmarks in each row represent the positions of the regulon genes in a list of all of the genes ranked by the interaction coefficient. Red marks indicate positive targets; blue marks indicate negative targets. Heatmap on the right indicates, for each master regulator, the direction of enrichment (blue = negative; red = positive). The top 30 significant master regulators are shown. (D) Inferred kinases induced by cabozantinib-dasatinib treatment: phosphoproteome: kinase activity driving the effect of drug interaction was inferred from the phosphoproteomic data ranked by the interaction coefficient using KSEA (q < 0.05). (E) Integrated transcriptomic/phosphoproteomic cabozantinib-dasatinib interaction network: RNA and phosphoproteome: cabozantinib-dasatinib interaction network generated from VIPER master regulator enrichment scores, KSEA kinase enrichment scores, and kinase using TieDIE algorithm and Multinet interaction network. Red nodes have increased expression due to the interaction effect; blue nodes have decreased expression due to the interaction effect. Rectangles indicate transcription factors and diamonds indicate kinases. (F) ACHN human kidney cancer cells were seeded and treated with either dasatinib (50 nM) or cabozantinib (10 μM), either alone or in combination. Lysates were made after 24 h of treatment and probed with the indicated antibodies. (G) Representative images of tumor tissue from ACHN xenografts treated with the indicated drug regimens were evaluated by immunofluorescence for p-ERK.
Figure 6
Figure 6
The validation of combining dasatinib and active clinical MEK inhibitors across VHL WT human kidney cancer cells (A–D) Dose response to MEK inhibitors is presented both as single agent (red) and in the presence of dasatinib (green). The best-fit line represents the variable slope (log(inhibitor) versus response). (A) trametinib; (B) selumetinib; (C) AS703026; and (D) AZD8330 (n = 4 inhibitors).
Figure 7
Figure 7
Combination assessments of dasatinib and preclinical MEK inhibitors, and the effect of the cabozantinib-cobimetinib combination (A–E): Dose response to MEK inhibitors is presented both as single agent (red) and in the presence of dasatinib (green). The best-fit line represents the variable slope (log(inhibitor) versus response). (A) PD325901, (B) CI-1040, (C) TAK733, (D) BIX02189, and (E) PD318088 (n = 5 inhibitors). (F) Dose-response curves of cell viability of human NCCRCC cell lines ACHN and SN12C to varying doses of cabozantinib and cobimetinib after 72 h of exposure. (G) Calculated median effect drug synergy CI scores (CalcuSyn) across cabozantinib and cobimetinib combinations. Horizontal dashed line indicates a CI = 1, where points below the line indicate synergy and points above indicate antagonism.

Similar articles

Cited by

References

    1. Bray F., Ferlay J., Soerjomataram I., Siegel R.L., Torre L.A., Jemal A. Global cancer statistics 2018: GLOBOCAN estimates of incidence and mortality worldwide for 36 cancers in 185 countries. CA Cancer J. Clin. 2018;68:394–424. - PubMed
    1. Saad A.M., Gad M.M., Al-Husseini M.J., Ruhban I.A., Sonbol M.B., Ho T.H. Trends in Renal-Cell Carcinoma Incidence and Mortality in the United States in the Last 2 Decades: A SEER-Based Study. Clin. Genitourin. Cancer. 2019;17:46–57.e5. - PMC - PubMed
    1. Siegel R.L., Miller K.D., Jemal A. Cancer statistics, 2018. CA Cancer J. Clin. 2018;68:7–30. - PubMed
    1. George D.J., Kaelin W.G., Jr. The von Hippel-Lindau protein, vascular endothelial growth factor, and kidney cancer. N. Engl. J. Med. 2003;349:419–421. - PubMed
    1. Kaelin W.G., Jr. The von Hippel-Lindau gene, kidney cancer, and oxygen sensing. J. Am. Soc. Nephrol. 2003;14:2703–2711. - PubMed

Publication types

MeSH terms

Supplementary concepts