. 2021 May 18;2(5):100280.
doi: 10.1016/j.xcrm.2021.100280.

Modifying gut integrity and microbiome in children with severe acute malnutrition using legume-based feeds (MIMBLE): A pilot trial

Affiliations

Modifying gut integrity and microbiome in children with severe acute malnutrition using legume-based feeds (MIMBLE): A pilot trial

Nuala Calder et al. Cell Rep Med. .

Abstract

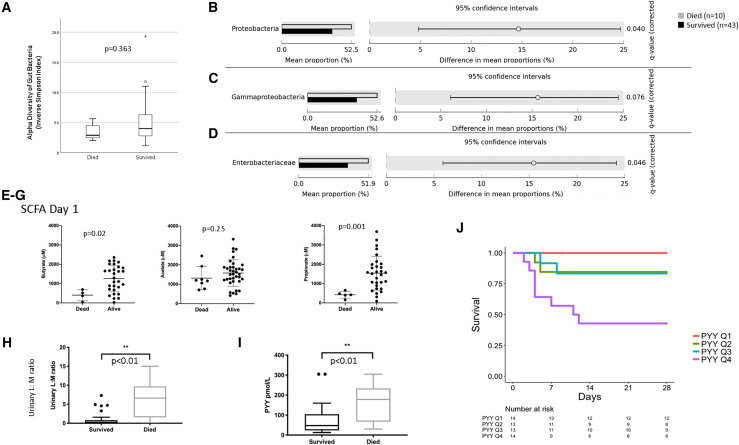
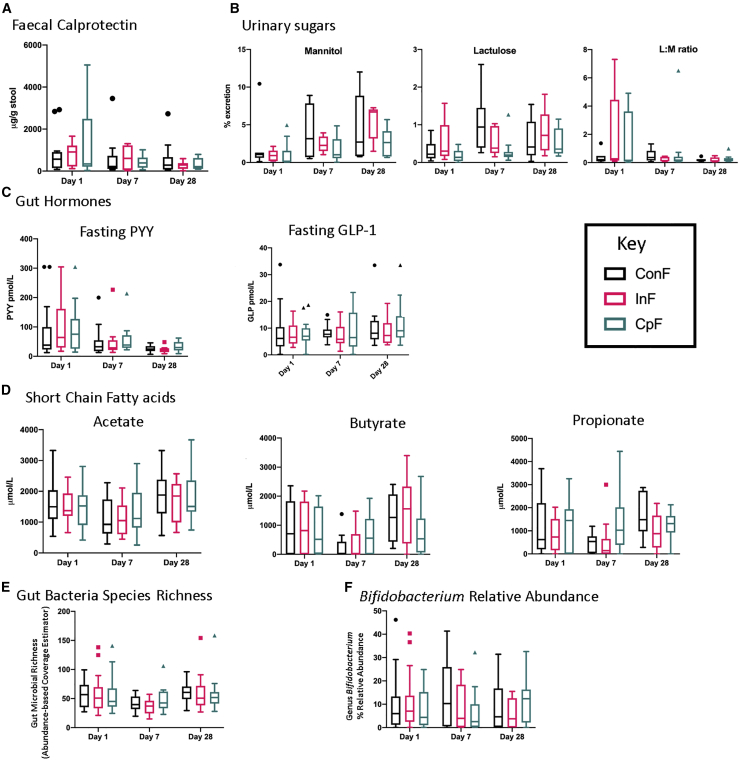
Case fatality among African children with severe acute malnutrition remains high. We report a 3-arm pilot trial in 58 Ugandan children, comparing feeds targeting disordered gastrointestinal function containing cowpea (CpF, n = 20) or inulin (InF, n = 20) with conventional feeds (ConF, n = 18). Baseline measurements of gut permeability (lactulose:mannitol ratio 1.19 ± SD 2.00), inflammation (fecal calprotectin 539.0 μg/g, interquartile range [IQR] 904.8), and satiety (plasma polypeptide YY 62.6 pmol/l, IQR 110.3) confirm gastrointestinal dysfunction. By day 28, no differences are observable in proportion achieving weight gain >5 g/kg/day (87%, 92%, 86%; p > 0.05), mortality (16%, 30%, 17%; p > 0.05), or edema resolution (83%, 54%, 91%; p > 0.05) among CpF, InF, and ConF. Decreased fecal bacterial richness from day 1 (abundance-based coverage estimator [ACE] 53.2) to day 7 (ACE 40.8) is observed only in ConF (p = 0.025). Bifidobacterium relative abundance increases from day 7 (5.8% ± 8.6%) to day 28 (10.9% ± 8.7%) in CpF (corrected p = 1.000). Legume-enriched feeds support aspects of gut function and the microbiome. Trial registration PACTR201805003381361.

Keywords: 16S rRNA; African children; NMR spectroscopy; clinical trial; gut barrier dysfunction; gut hormones; metabolome; microbiome; nutritional feeds; severe malnutrition; short-chain fatty acid.


Conflict of interest statement

The authors declare no competing interests.

Figures

None
Graphical abstract
Figure 1
Figure 1
Pre-clinical study in vitro batch culture: microbiota for the three feeds, days exposed to nutritional treatment, and co-primary endpoint (survival) (A and B) Total bacteria and Bifidobacteria following the batch culture experiment performed in triplicate. (C) Number of days children received nutritional feeds/treatment by arm (SD). ConF, n = 18; InF, n = 20; CpF, n = 20. (D) Primary and secondary outcomes; data for weight gain to day 28 are reported for survivors to this time point. Additional characteristics are summarized in Table S1.
Figure 2
Figure 2
Baseline parameters of children with respect to outcome (death versus survival) for all children irrespective of intervention arm (A–D) Baseline diversity of the microbiota by outcome (A), phylum (B), class (C), and family level (D). Benjamini-Hochberg FDR-corrected p values are shown. n = 53 (died n = 10/survived n = 43). (E–G) Fecal SCFAs. (E) n = 33 (n = 4 died, n = 29 survived); (F) n = 45 (n = 8 died, n = 37 survived); (G) n = 35 (n = 5 died, n = 30 survived). (H) Urinary L:M ratio. n = 37 (n = 7 died, n = 30 survived). (I) Plasma concentrations of PYY (peptide tyrosine tyrosine) at baseline. n = 54 (n = 12 died, n = 42 survived). (J) Kaplan-Meier plots for the quartiles of plasma PYY and survival status. n = 54 Results are presented as medians with 95% confidence limits (CLs). Comparisons between intervention arms are made by Kruskal-Wallis one-way analysis of variance and Mann-Whitney U test. Baseline fecal samples were available for 53/58 children only, hence the results reported above for diversity (A), bacterial phyla (B), classes (C), and families (D) and fecal SCFAs are reported for available samples only. Sample numbers vary due to sample availability. Additional Cox proportional hazards models are reported in Table S2.
Figure 3
Figure 3
Changes over three time points (day 1, day 7, and day 28) of gut function markers in children receiving ConF (n = 18) (A and B) Admission 16S rRNA-derived bacterial phyla relative abundances for F75 control arm at each time point demonstrating Proteobacteria are higher in days 1 and 7 than in day 28. Firmicutes are higher in day 28 than in days 1 and 7, and Bacteroidetes are higher in day 28 than in day 7. Day 1, n = 16; day 7, n = 13; day 28, n = 13. (C) Fecal SCFA concentrations. Days 1/7/28: acetate, n = 13/13/13; propionate, n = 13/13/13; butyrate, n = 13/13/13. (D) Fecal calprotectin. Days 1/7/28: n = 13/13/13. (E) Plasma PYY. Days 1/7/28: n = 17/15/14. (F) L:M ratio. Days 1/7/28: n = 7/7/7. (G) OPLS-DA (Orthogonal Projection to Latent structures-Discriminant Analysis) scores and loading plots of plasma 1H NMR spectra showing differentiation in metabolite profiles of day 1 to day 7. Days 1/7: n = 14/14. Comparisons between days were made by t test or ANOVA where relevant.
Figure 4
Figure 4
Differences among the three intervention arms over time (days 1, 7, and 28) on markers of gut function (A) Fecal calprotectin. ConF/InF/CpF: day 1, n = 13/10/15; day 7, n = 13/15/15; day 28, n = 13/10/15. (B) Mannitol lactulose test. ConF/InF/CpF: day 1, n = 7/5/10; day 7, n = 7/5/10; day 28, n = 7/5/10. (C) Fasting PYY and GLP-1. ConF/InF/CpF: day 1, n = 17/18/19; day 7, n = 15/12/15; day 28, n = 14/9/14. (D) Fecal SCFAs. ConF/InF/CpF: day 1, n = 13/15/17; day 7, n = 13/13/15; day 28, n = 13/10/15. (E) ACE (abundance-based coverage estimator) assessment of fecal bacterial richness. ConF/InF/CpF: day 1, n = 16/19/18; day 7, n = 13/13/15; day 28, n = 13/10/15. (F) Bifidobacterium relative abundance. Data are presented as median with 95% CL. ConF/InF/CpF: day 1, n = 13/18/17; day 7, n = 13/13/15; day 28, n = 13/10/15. Comparison between and within intervention arms was carried out using Kruskal-Wallis one-way analysis of variance. Full experimental results are reported in Tables S3 and S4.

References

    1. World Health Organization . 2017 ed. World Health Organization; 2017. Children: reducing mortality. 01/10.
    1. Black R.E., Victora C.G., Walker S.P., Bhutta Z.A., Christian P., de Onis M., Ezzati M., Grantham-McGregor S., Katz J., Martorell R., Uauy R., Maternal and Child Nutrition Study Group Maternal and child undernutrition and overweight in low-income and middle-income countries. Lancet. 2013;382:427–451. - PubMed
    1. Bhutta Z.A., Berkley J.A., Bandsma R.H.J., Kerac M., Trehan I., Briend A. Severe childhood malnutrition. Nat. Rev. Dis. Primers. 2017;3:17067. - PMC - PubMed
    1. Maitland K., Berkley J.A., Shebbe M., Peshu N., English M., Newton C.R. Children with severe malnutrition: can those at highest risk of death be identified with the WHO protocol? PLoS Med. 2006;3:e500. - PMC - PubMed
    1. Gachau S., Irimu G., Ayieko P., Akech S., Agweyu A., English M., Clinical Information Network Author Group Prevalence, outcome and quality of care among children hospitalized with severe acute malnutrition in Kenyan hospitals: A multi-site observational study. PLoS ONE. 2018;13:e0197607. - PMC - PubMed

Publication types

Substances