

Behavior of the electron spin resonance signals in X-ray irradiated human fingernails for the establishment of a dose reconstruction procedure
- PMID: 34095957
- PMCID: PMC8438265
- DOI: 10.1093/jrr/rrab027
Behavior of the electron spin resonance signals in X-ray irradiated human fingernails for the establishment of a dose reconstruction procedure
Abstract
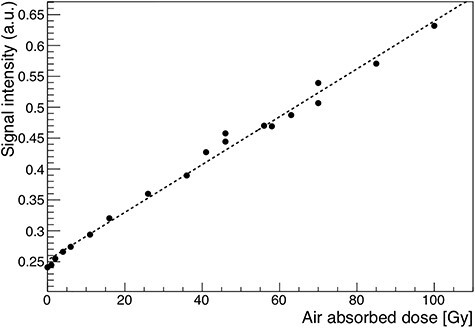
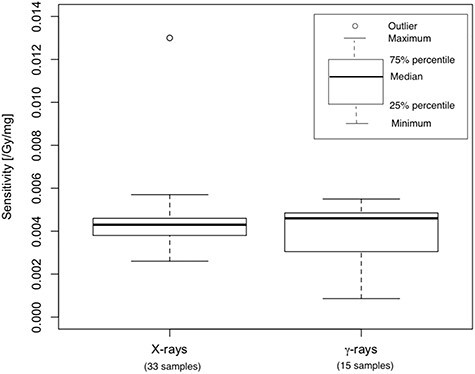
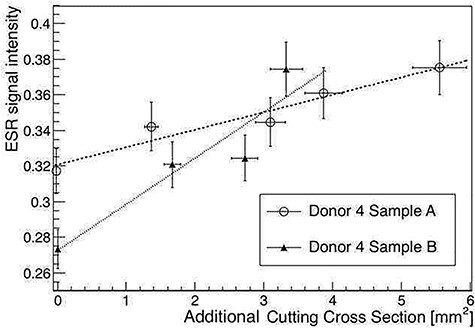
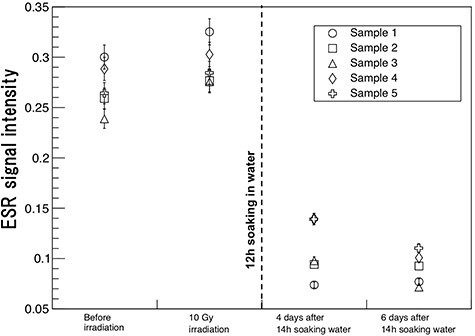
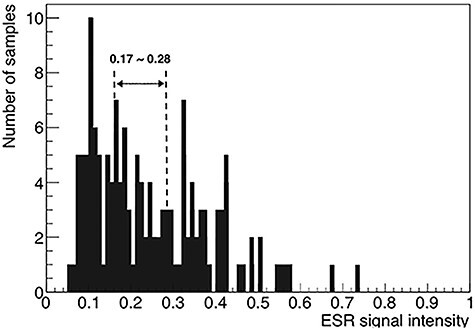
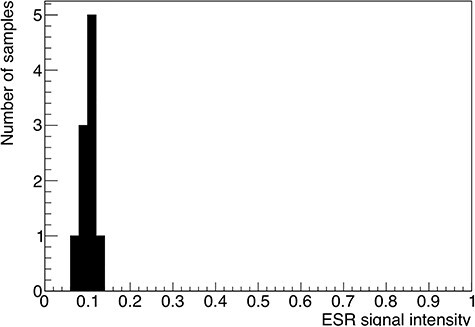
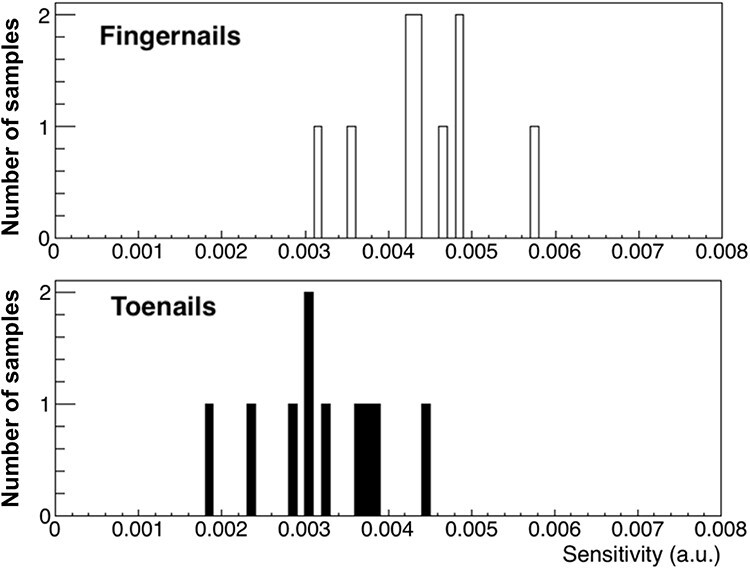
The retrospective dosimetry that follows accidental X-ray exposure is becoming more significant for improving radiation diagnosis and treatment. We investigated the dosimetric properties of electron spin resonance (ESR) signals in X-ray irradiated fingernails under conditions that resemble realistic situations. We collected fingernails from 12 Japanese donors between the ages of 30 to 70. The sampled fingernails were utilized for X-ray irradiation, mechanical stimulation and background measurements. We also collected 10 toenails from one of the donors to evaluate their differences from fingernails. Additionally, we prepared 15 samples from two donors to compare the signals generated by γ-rays to those by X-rays. After observing the linear dose-response for both X- and γ-ray irradiated samples, we found that the sensitivity of the air-absorbed dose of γ-ray irradiated samples was identical to that of X-ray irradiated samples. The effect from secondary electrons seemed to be small in fingernails. The inter-individual variation in the sensitivity was no greater than the intra-individual variation. The signal intensities in each measurement fluctuated about the linear response curve, and the size of the fluctuation was dependent on the sample. The average fluctuation corresponded to 1.7 Gy, and the standard deviation was 1.3 Gy. The signal induced by X-rays could be erased by soaking the samples in water and subsequently drying them for four days, which allowed us to estimate the signal intensity prior to the exposure. These characteristics of the ESR signal induced by X-rays facilitate the development of a feasible protocol for fingernail dose reconstruction.
Keywords: electron paramagnetic resonance (EPR); electron spin resonance (ESR); fingernail; retrospective dosimetry; toenail.
© The Author(s) 2021. Published by Oxford University Press on behalf of The Japanese Radiation Research Society and Japanese Society for Radiation Oncology. All rights reserved. For permissions, please e-mail: journals.permissions@oup.com.
Figures
Similar articles
-
The effects of age and other individual factors on radiation induced ESR signals from fingernails.Front Public Health. 2025 Jan 15;13:1531253. doi: 10.3389/fpubh.2025.1531253. eCollection 2025. Front Public Health. 2025. PMID: 39882348 Free PMC article.
-
Electron paramagnetic resonance in irradiated fingernails: variability of dose dependence and possibilities of initial dose assessment.Radiat Environ Biophys. 2009 Aug;48(3):295-310. doi: 10.1007/s00411-009-0232-1. Epub 2009 Jun 12. Radiat Environ Biophys. 2009. PMID: 19521713
-
Determining Dosimetric Properties and Lowest Detectable Dose of Fingernail Clippings from their Electron Paramagnetic Resonance Signal.Health Phys. 2015 Jul;109(1):10-4. doi: 10.1097/HP.0000000000000277. Health Phys. 2015. PMID: 26011494
-
Electron paramagnetic resonance radiation dose assessment in fingernails of the victim exposed to high dose as result of an accident.Radiat Environ Biophys. 2014 Nov;53(4):755-62. doi: 10.1007/s00411-014-0553-6. Epub 2014 Jun 24. Radiat Environ Biophys. 2014. PMID: 24957016
-
Electron paramagnetic resonance in human fingernails: the sponge model implication.Radiat Environ Biophys. 2008 Nov;47(4):515-26. doi: 10.1007/s00411-008-0178-8. Epub 2008 Jun 27. Radiat Environ Biophys. 2008. PMID: 18584193
Cited by
-
The effects of age and other individual factors on radiation induced ESR signals from fingernails.Front Public Health. 2025 Jan 15;13:1531253. doi: 10.3389/fpubh.2025.1531253. eCollection 2025. Front Public Health. 2025. PMID: 39882348 Free PMC article.
References
-
- Dalgarnov B, McClymont J. Evaluation of ESR as a radiation accidentdosimetry technique. International Journal of Radiation Applications and Instrumentation Part A Applied Radiation and Isotopes 1989;40:1013–20.
-
- Reyes R, Trompier F, Romanyukha A. Study of the stability of EPR signals after irradiation of fingernail samples. Health Phys 2012;103:175–80. - PubMed
-
- Wang L, Wang X, Zhang W et al. Determining dosimetric properties and lowest detectable dose of fingernail clippings from their electron paramagnetic resonance signal. Health Phys 2015;109:10–4. - PubMed
Publication types
MeSH terms
Grants and funding
LinkOut - more resources
Full Text Sources
Miscellaneous
