

Long time behavior and stable patterns in high-dimensional polarity models of asymmetric cell division
- PMID: 34095962
- PMCID: PMC8180481
- DOI: 10.1007/s00285-021-01619-w
Long time behavior and stable patterns in high-dimensional polarity models of asymmetric cell division
Abstract
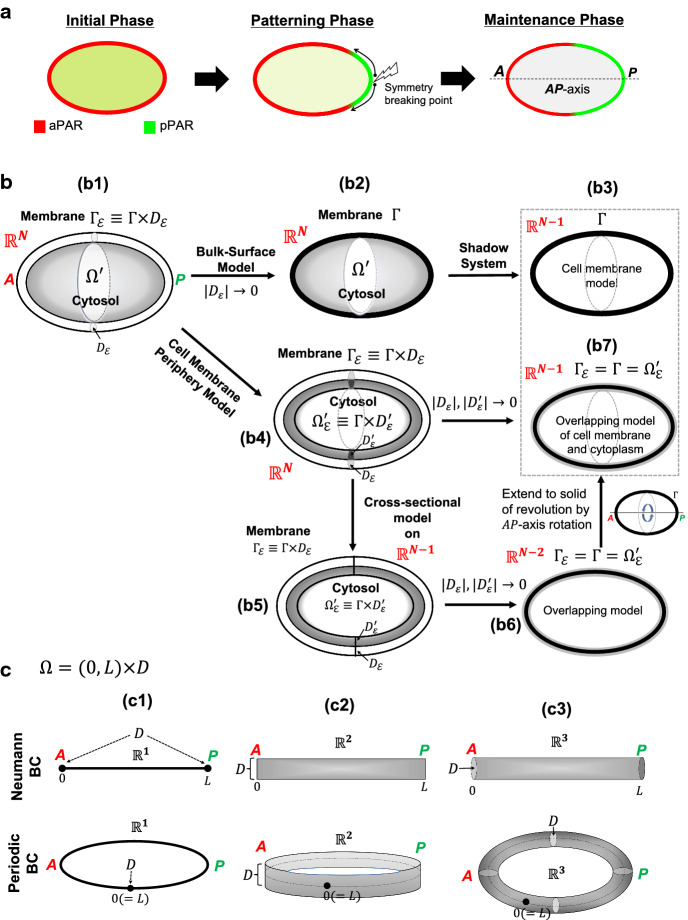
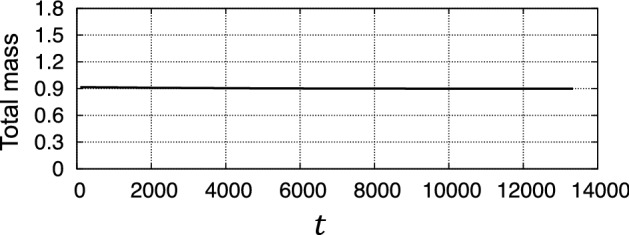
Asymmetric cell division is one of the fundamental processes to create cell diversity in the early stage of embryonic development. During this process, the polarity formation in the cell membrane has been considered as a key process by which the entire polarity formation in the cytosol is controlled, and it has been extensively studied in both experiments and mathematical models. Nonetheless, a mathematically rigorous analysis of the polarity formation in the asymmetric cell division has been little explored, particularly for bulk-surface models. In this article, we deal with polarity models proposed for describing the PAR polarity formation in the asymmetric cell division of a C. elegans embryo. Using a simpler but mathematically consistent model, we exhibit the long time behavior of the polarity formation of a bulk-surface cell. Moreover, we mathematically prove the existence of stable polarity solutions of the model equation in an arbitrary high-dimensional domain and analyse how the boundary position of polarity domain is determined. Our results propose that the existence and dynamics of the polarity in the asymmetric cell division can be understood universally in terms of basic mathematical structures.
Keywords: ..
Figures


Similar articles
-
The Role of Cytoplasmic MEX-5/6 Polarity in Asymmetric Cell Division.Bull Math Biol. 2021 Feb 17;83(4):29. doi: 10.1007/s11538-021-00860-0. Bull Math Biol. 2021. PMID: 33594535 Free PMC article.
-
Asymmetric cell division from a cell to cells: Shape, length, and location of polarity domain.Dev Growth Differ. 2020 Apr;62(3):188-195. doi: 10.1111/dgd.12652. Epub 2020 Mar 2. Dev Growth Differ. 2020. PMID: 32120453 Free PMC article. Review.
-
Cell polarity and asymmetric cell division: the C. elegans early embryo.Essays Biochem. 2012;53:1-14. doi: 10.1042/bse0530001. Essays Biochem. 2012. PMID: 22928504 Review.
-
Transitions to slow or fast diffusions provide a general property for in-phase or anti-phase polarity in a cell.J Math Biol. 2020 May;80(6):1885-1917. doi: 10.1007/s00285-020-01484-z. Epub 2020 Mar 20. J Math Biol. 2020. PMID: 32198524 Free PMC article.
-
Asymmetric Cell Division in the One-Cell C. elegans Embryo: Multiple Steps to Generate Cell Size Asymmetry.Results Probl Cell Differ. 2017;61:115-140. doi: 10.1007/978-3-319-53150-2_5. Results Probl Cell Differ. 2017. PMID: 28409302 Review.
Cited by
-
Delineating the mechanisms and design principles of Caenorhabditis elegans embryogenesis using in toto high-resolution imaging data and computational modeling.Comput Struct Biotechnol J. 2022 Aug 19;20:5500-5515. doi: 10.1016/j.csbj.2022.08.024. eCollection 2022. Comput Struct Biotechnol J. 2022. PMID: 36284714 Free PMC article. Review.
-
Balancing reaction-diffusion network for cell polarization pattern with stability and asymmetry.Elife. 2025 Jul 22;13:RP96421. doi: 10.7554/eLife.96421. Elife. 2025. PMID: 40693535 Free PMC article.
-
Turing Pattern Formation in Reaction-Cross-Diffusion Systems with a Bilayer Geometry.Bull Math Biol. 2024 Jan 3;86(2):13. doi: 10.1007/s11538-023-01237-1. Bull Math Biol. 2024. PMID: 38170298 Free PMC article.
References
-
- Car J, Pego R. Metastable patterns in solutions of Commun Pure Appl Math. 1989;42:523–576. doi: 10.1002/cpa.3160420502. - DOI
-
- Coffmana VC, McDermottb MBA, Shtyllac B, Dawes AT. Stronger net posterior cortical forces and asymmetric microtubule arrays produce simultaneous centration and rotation of the pronuclear complex in the early Caenorhabditis elegans embryo. Mol Biol Cell. 2016;27(22):3377–3685. doi: 10.1091/mbc.e16-09-0673. - DOI - PMC - PubMed
-
- Cooper G. M. The cell: a molecular approach. 2nd. Sunderland: Sinauer Associates, Inc; 2000.
Publication types
MeSH terms
Substances
LinkOut - more resources
Full Text Sources
