Review
. 2021 Jul;302(1):68-85.
doi: 10.1111/imr.12985. Epub 2021 Jun 6.

The fibroblast: An emerging key player in thymic T cell selection

Affiliations
Review

The fibroblast: An emerging key player in thymic T cell selection

Takeshi Nitta et al. Immunol Rev. 2021 Jul.

Abstract

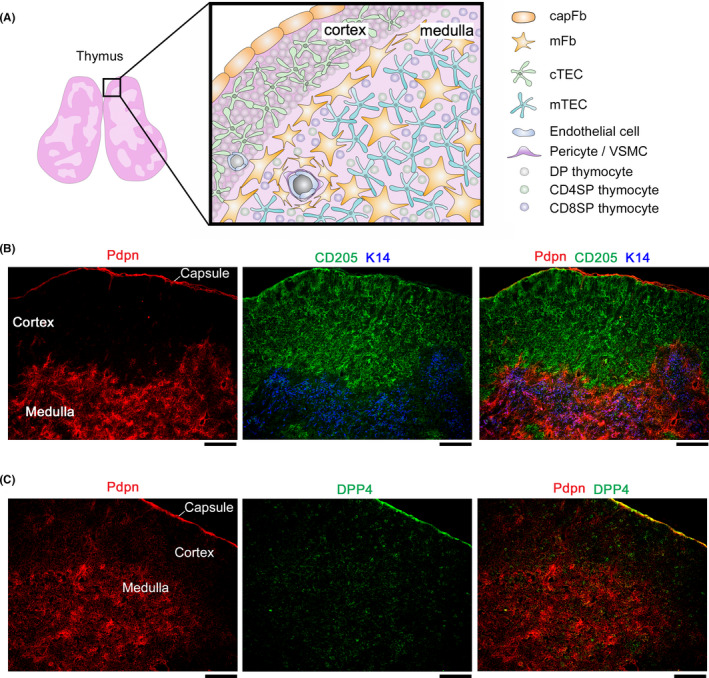
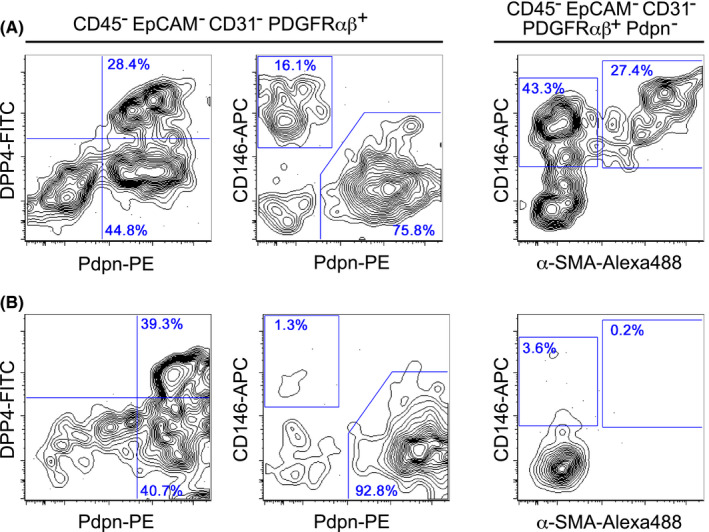
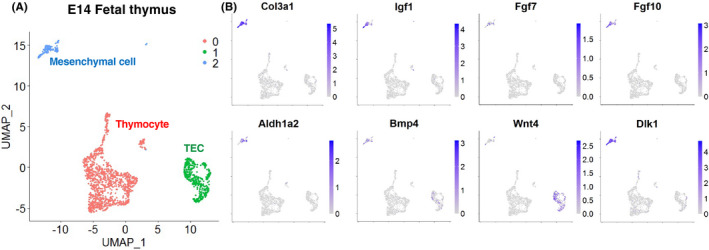
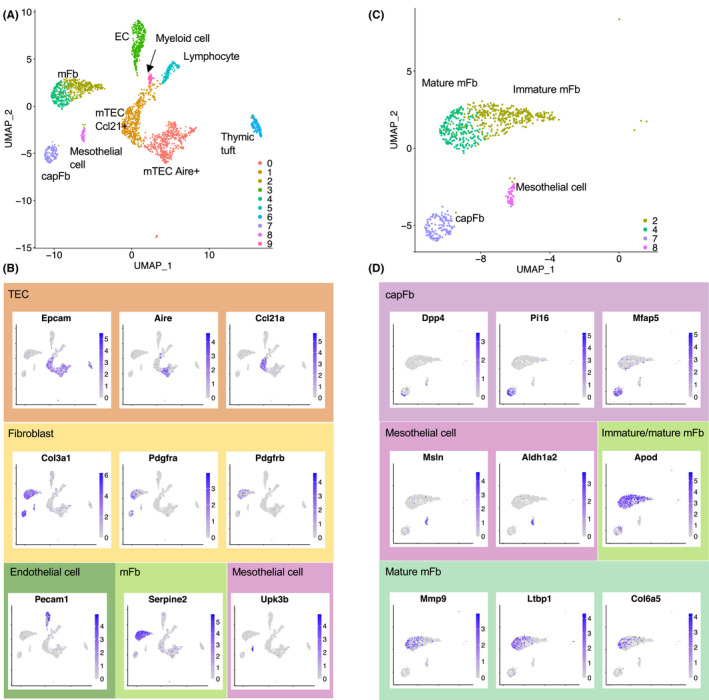
Fibroblasts have recently attracted attention as a key stromal component that controls the immune responses in lymphoid tissues. The thymus has a unique microenvironment comprised of a variety of stromal cells, including fibroblasts and thymic epithelial cells (TECs), the latter of which is known to be important for T cell development because of their ability to express self-antigens. Thymic fibroblasts contribute to thymus organogenesis during embryogenesis and form the capsule and medullary reticular network in the adult thymus. However, the immunological significance of thymic fibroblasts has thus far only been poorly elucidated. In this review, we will summarize the current views on the development and functions of thymic fibroblasts as revealed by new technologies such as multicolor flow cytometry and single cell-based transcriptome profiling. Furthermore, the recently discovered role of medullary fibroblasts in the establishment of T cell tolerance by producing a unique set of self-antigens will be highlighted.

Keywords: T cell; Thymus; capsule; fibroblast; medulla.


Conflict of interest statement

There is no conflict of interest to declare.

Figures

FIGURE 1
FIGURE 1
Thymic architecture and stromal cell localization. (A) Schematic depicting the thymic structure and the localization of stromal cells and thymocytes. (B and C) Thymus sections from 5‐week‐old C57BL/6 mice were stained for the indicated markers; Pdpn (fibroblasts), CD205 (cTECs), keratin 14 (K14) (mTECs), and DPP4 (capFbs). The scale bars indicate 100 µm. (B) Thymic fibroblasts expressing Pdpn are localized in the medulla as well as the capsule of the thymus. (C) DPP4 expression segregates the Pdpn+ thymic fibroblasts into capFbs and mFbs
FIGURE 2
FIGURE 2
Flow cytometry detection of thymic fibroblast subsets. Thymic stromal cells were prepared using 0.01% Liberase TM (Roche) (A) or 0.125% collagenase D (Roche) (B) from 5‐week‐old C57BL/6 mice, as described previously., Representative flow cytometry profiles of gated stromal cell populations are shown. (A) In the Liberase TM‐dissociated, CD45 EpCAM CD31 PDGFRαβ+ cell population, Pdpn+ DPP4+ cells (capFbs) and Pdpn+ DPP4 cells (mFbs) were detected. The Pdpn CD146+ cells contain α‐SMA pericytes and α‐SMA+ VSMCs. (B) In the collagenase D‐dissociated cell suspension, the Pdpn CD146+ α‐SMA pericytes and Pdpn CD146+ α‐SMA+ VSMCs were found at a very low frequency or were almost undetectable, while capFbs and mFbs were readily detectable
FIGURE 3
FIGURE 3
Single‐cell transcriptome of fetal thymic cells. (A) Two‐dimensional representation of E14 fetal thymic cells. Data from the Gene Expression Omnibus (GEO) database under accession no. GSE107910 were used for UMAP clustering. Each dot represents a single cell. The full source code for analysis is available in GitHub (https://github.com/nittatakeshi/ImmunolRev_Fig3). (B) Expression profiles of the genes which are known to control fetal TEC differentiation and expansion. Col3a1 was used as a marker of mesenchymal cells
FIGURE 4
FIGURE 4
Single‐cell transcriptome of adult thymic stromal cells. Single‐cell RNA‐seq data of mouse thymic stromal cells (GEO accession no. GSE103967, Experiment ID thymus_stroma_WT) were used for UMAP clustering. The full source code for analysis is available in GitHub (https://github.com/nittatakeshi/ImmunolRev_Fig4). (A) Two‐dimensional representation of cells by UMAP. Each dot represents one cell. (B) Projection of representative genes. Clusters 0, 1, and 6 are TEC subsets defined by the expression of Epcam as well as key genes such as Aire or Ccl21a. Cluster 3 represents endothelial cells (ECs) expressing Pecam1. Clusters 2, 4, 7, and 8 represent thymic fibroblasts characterized by the expression of Col3a1, Pdgfra, and Pdgfrb. Contaminating lymphocytes (cluster 5) and myeloid cells (cluster 9) are also included. (C) Thymic fibroblast subsets (clusters 2, 4, 7, and 8) are highlighted. (D) Cluster 7 represents capFbs expressing Dpp4, Pi16, and Mfap5. Cluster 8 represents mesothelial cells defined by a high expression of Msln. mFbs (clusters 2 and 4) can be subdivided into immature and mature mFbs, and the latter express Mmp9, Ltbp1, and Col6a5
FIGURE 5
FIGURE 5
Gene expression profiling of capFbs and mFbs by whole transcriptome analysis. (A) KEGG pathway analysis of genes differentially expressed in capFbs and mFbs. Genes highly expressed in capFbs (capFbs/mFbs > 2, mean RPKM of capFbs > 10, P <.05) or in mFbs (mFb/capFb > 2, mean RPKM of mFb > 10, P <.05) were collected from bulk RNA‐seq data (GEO accession no. GSE147357) and subjected to KEGG pathway enrichment analysis using DAVID 6.8. (B) Heat map showing the relative expression of genes categorized as being in the Wnt signaling pathway, TNF signaling pathway, and NF‐κB signaling pathway, as well as antigen processing and presentation
FIGURE 6
FIGURE 6
Comparison of the whole transcriptome between thymic mFbs and lymph node FRCs. RNA‐seq data of mFbs, mesenteric lymph node (mLN) FRCs, and skin‐draining lymph node (sLN) FRCs (GEO accession no. GSE147357) were used. (A, B) GO term enrichment analysis of genes preferentially expressed in lymph node (LN) FRCs or mFbs. Genes preferentially expressed in LN FRCs compared to mFbs (mLN FRCs: mLN FRCs/mFbs > 5, sLN FRCs: sLN FRCs/mFbs > 5) (A) or in mFbs compared to LN FRCs (mLN.FRCs: mFbs /mLN FRCs > 5, sLN.FRCs: sLN FRCs/mFbs > 5) (RPKM > 10 in any of the groups) were subjected to GO term enrichment analysis using DAVID 6.8. (C) Scatter plot of the gene expression ratio between mLN FRCs/mFbs and sLN FRCs/mFbs. The genes associated with the immune response and the chemokine‐mediated signaling pathway in (A) are highlighted in red. The genes associated with extracellular matrix organization in (B) are highlighted in blue
FIGURE 7
FIGURE 7
LTβR‐dependent genes in mFbs include TRAs. To define the TRAs, the Shannon entropy score was calculated using the gene expression profiles (GEO accession no. GSE10246). The full source code for analysis is available in GitHub (https://github.com/nittatakeshi/ImmunolRev_Fig7). Genes with an entropy score of less than 3.5 are defined as TRA genes. Although these TRA genes were extracted from comprehensive transcriptome data by unbiased mathematical calculation, they may also contain genes that encode functional proteins in mFbs and fibroblast lineage‐specific proteins. (A) The gene expression data on the mFbs from LtbrΔFb mice (Twist2‐Cre Ltbrflox/flox (n = 4)) compared to those from control mice (C57BL/6 (n = 2) and Ltbrflox/flox (n = 4)) are from an RNA‐seq dataset (GEO accession no. GSE147357). TRA genes with a mean RPKM >10 in the control mFbs and the ratio of RPKM (LtbrΔFb /control) > 0.5 and significant (P <.05) are shown. (B) LTβR‐dependent TRA genes expressed in mFbs, representative TRA genes expressed in mTECs, and representative housekeeping genes are listed. Expression specificity was determined by computationally extracting the tissues or cell types that showed the highest mRNA expression values
FIGURE 8
FIGURE 8
Induction of T cell tolerance by mFbs and mTECs. The immature mFbs give rise to mature mFbs upon interaction with SP thymocytes expressing lymphotoxin (LTα1β2). The mature mFbs promote mTEC development. Both mTECs and mFbs express and present self‐antigens, thus contributing to the deletion of self‐reactive SP thymocytes and the establishment of central tolerance

References

    1. Miller JFAP. The function of the thymus and its impact on modern medicine. Science. 2020;369(6503):eaba2429. - PubMed
    1. Han J, Zúñiga‐Pflücker JC. A 2020 view of thymus stromal cells in T cell development. J Immunol. 2021;206:249‐256. - PMC - PubMed
    1. Abramson J, Anderson G. Thymic epithelial cells. Annu Rev Immunol. 2017;35:85‐118. - PubMed
    1. Kadouri N, Nevo S, Goldfarb Y, Abramson J. Thymic epithelial cell heterogeneity: TEC by TEC. Nat Rev Immunol. 2020;20:239‐253. - PubMed
    1. Ohigashi I, Kozai M, Takahama Y. Development and developmental potential of cortical thymic epithelial cells. Immunol Rev. 2016;271:10‐22. - PubMed

Publication types