. 2021 Jun 21;49(11):6267-6280.
doi: 10.1093/nar/gkab446.

Human prefoldin modulates co-transcriptional pre-mRNA splicing

Affiliations

Human prefoldin modulates co-transcriptional pre-mRNA splicing

Laura Payán-Bravo et al. Nucleic Acids Res. .

Abstract

Prefoldin is a heterohexameric complex conserved from archaea to humans that plays a cochaperone role during the co-translational folding of actin and tubulin monomers. Additional functions of prefoldin have been described, including a positive contribution to transcription elongation and chromatin dynamics in yeast. Here we show that prefoldin perturbations provoked transcriptional alterations across the human genome. Severe pre-mRNA splicing defects were also detected, particularly after serum stimulation. We found impairment of co-transcriptional splicing during transcription elongation, which explains why the induction of long genes with a high number of introns was affected the most. We detected genome-wide prefoldin binding to transcribed genes and found that it correlated with the negative impact of prefoldin depletion on gene expression. Lack of prefoldin caused global decrease in Ser2 and Ser5 phosphorylation of the RNA polymerase II carboxy-terminal domain. It also reduced the recruitment of the CTD kinase CDK9 to transcribed genes, and the association of splicing factors PRP19 and U2AF65 to chromatin, which is known to depend on CTD phosphorylation. Altogether the reported results indicate that human prefoldin is able to act locally on the genome to modulate gene expression by influencing phosphorylation of elongating RNA polymerase II, and thereby regulating co-transcriptional splicing.


Figures

Figure 1.
Figure 1.
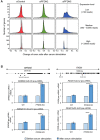
Two prefoldin subunits, PFDN5 and PFDN2, influence gene expression in human cells. HCT166 cells were treated with the different siRNAs for 24 h, then serum-starved for 48 h, then gene expression was induced by adding serum, and samples were taken just before and 90 min after stimulation. (A) MA plots of RNA-seq experiments. The logarithm of the fold change (log2(FC siPFDN/siControl)) is shown against the logarithm (log10(CPM)) of the level of gene expression (defined for each gene as the mean of the counts per million of all the samples). The graphs on the left show the transcriptomic changes of the samples transfected with the siPFDN5 with respect to the control, and those on the right, those of the samples transfected with the siPFDN2. Unaffected genes are represented in black, while in red are all those genes showing |log2(FC)| > 0, FRD < 0.05. The upper panels represent the data of the samples taken before serum stimulation, while the lower panels represent those taken after serum stimulation. (B) Representation of the number of genes induced by serum in control cells (log2(FC after/before serum treatment) > 1, FDR < 0.05), and those whose stimulation was significantly affected by siPFDN2 or siPFDN5 (FDR > 0.05). (C) Overlap between those genes whose induction by serum was impaired by PFDN2 and PFDN5 depletion. The P-value after a hypergeometric test is also shown.
Figure 2.
Figure 2.
Prefoldin deficiency impairs the induction of long genes with a high number of introns. A) Expression differences between siPFDN5 and siControl cells (log2(FC)) with respect to the gene length, before and after serum stimulation. The genes were separated into quintiles. The * represents P < 0.005 in a Student′s t test comparing each quintile to quintile 1. (B) The same analysis of A with respect to the number of introns that each gene contains, before and after serum stimulation. The genes were separated into quintiles. The * represents P < 0.005 in a Student's t test comparing each quintile to quintile 1. (C) Serum regulated genes (|log2(FC)| > 0 and FDR < 0.05, N = 1035) were divided into three groups according to the tercile of the number of introns. Serum-dependent fold change (Log2) is represented against the gene length (Log10), in cells transfected with the siControl (solid line) or siPFDN5 (dotted line).
Figure 3.
Figure 3.
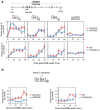
Prefoldin deficiency reduces splicing efficiency under serum stimulation conditions. (A) The change of the exon ratio after serum stimulation is represented. This change was calculated as follows: [exonic readsa /total readsa] – [exonic readsb /total readsb] where ‘a’ means after serum induction, and ‘b’ means before serum induction. Since the ratios are dimensionless quantities, the difference between them is also dimensionless. The genes were divided into three groups according to their expression level (high, medium and low levels). The expression level of each gene was defined as the mean number of reads per million of all the samples, after normalizing by gene length. (B) Control and PFDN5 KO cells were treated as in Figure 1 and the level of pre-mRNA in two different regions of the SRRM2 and FASN genes was determined by amplifying an intron-exon junction. The graphs represent the average and the standard deviation obtained from three different biological replicates. Pre-mRNA data was normalized first to mature mRNA level, and then to time zero. A total number of three biological replicates, with three technical replicates each, were considered for Student's t test; ****P < 0.0001.
Figure 4.
Figure 4.
PFDN5 depletion impairs co-transcriptional splicing in the long CTNNBL1 gene. (A) Pre-mRNA levels at different loci throughout the CTNNBL1 gene in cells transfected with control siRNA (red line) or PFDN5 siRNA (blue line) (upper panels), and in WT (red line) or PFDN5 KO cells (blue line) (lower panels). Cells were treated with 100 μM DRB for 3 h. Samples were taken every 10 min after washing DRB out. Pre-mRNA data was normalized first to the mature mRNA, and next to the DRB untreated sample. A scheme of the CTNNBL1 gene is also shown, and the different amplicons used are depicted above each graph. (B) Event of co-transcriptional splicing (measured as the presence of pre-mRNA without the indicated intron) in the CTNNBL1 gene in cells treated as in A). The amplicon used is depicted above the graph. The average and standard error of at least three biological replicates are represented.
Figure 5.
Figure 5.
PFDN5 is present in the chromatin of active genes. (A) Metagene analysis of the ChIP-seq signal of Flag-PFDN5. Protein coding genes were separated between expressed (>0.1 reads per kilobase per million, RPKM) and not expressed genes (<0.1 RPKM). Genes were scaled to the same length from the transcription start site (TSS) to the transcription termination site (TTS). Upstream and downstream sequences up to 5 kb are represented unscaled. (B) Heatmaps of the ChIP-seq signals of RNA pol II and PFDN5. Genes were ordered according to their RNA pol II signal. Centred in the TSS, 2 kb are represented upstream and downstream. (C) The gene body signal of total RNA pol II (left panel) or Ser2P RNA pol II (right panel) was represented with respect to the PFDN5 signal in the same region. Expressed genes (>0.1 RPKM) were ordered according to the PFDN5 signal and divided into 100 bins. The mean signal of each group was then calculated and represented. The R and p values from Pearson′s correlation are shown. (D) The levels of Flag-PFDN5 were measured by ChIP-qPCR in different regions of the CTNNBL1 (left panel) and CD44 (right panel) genes using anti-Flag antibody in control (light pink) and Flag-PFDN5 cells (dark pink). An intergenic region in chromosome 5 was used as the non-transcribed negative control. A total number of three biological replicates, with three technical replicates each, were considered for Student's t test. *P < 0.05, **P < 0.005. (E) The PFDN5 signal was represented with respect to the fold change of expression in the siPFDN5 RNA-seq data under serum starvation conditions. Expressed genes (>0.1 RPKM) were ordered according to the FC and divided into 100 bins. The mean signal of each group was calculated and represented against the mean PFDN5 signal around the promoter (TSS ± 500 bp). The R and P values from Pearson′s correlation are shown.
Figure 6.
Figure 6.
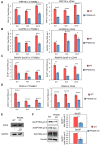
Lack of PFDN5 decreases PRP19, U2AF65 and CDK9 recruitment to transcribed chromatin and Ser2 phosphorylation of elongating RNA pol II. (A) The levels of PRP19 were measured by ChIP in different regions of the CTNNBL1 (left panel) and the CD44 (right panel) genes, using anti-PRP19 antibody in control (red bars) and PFDN5 KO cells (blue bars). Values were normalized to total RNA pol II levels. (B) The levels of U2AF65 were measured by ChIP in different regions of the CTNNBL1 (left panel) and the CD44 (right panel) genes, using anti-U2AF65 antibody in control (red bars) and PFDN5 KO cells (blue bars). Values were normalized to total RNA pol II levels. (C) The levels of Ser2-phosphorylated RNA pol II were measured by ChIP in different regions of the CTNNBL1 (left panel) and the CD44 (right panel) genes using an anti-Ser2P-CTD specific antibody, in control (red bars) and PFDN5 KO cells (blue bars). RNA pol II CTD-Ser2P values were normalized to total RNA pol II levels. (D) The levels of CDK9 were measured by ChIP in different regions of the CTNNBL1 (left panel) and the CD44 (right panel) genes using an anti-CDK9 specific antibody, in control (red bars) and PFDN5 KO cells (blue bars). Values were normalized to total RNA pol II levels. (E) Global CDK9 protein levels analysed by western blotting in control and PFDN5 KO cells. GAPDH was used as a loading control. Averaged values and standard deviation of the CDK9/GAPDH ratio from three experiments are shown. (F) The global levels of Ser2P and Ser5P forms of RNA pol II were measured by western blot in control and PFDN5 KO cells. Anti-vinculin antibody was used a loading control. A representative experiment is shown on the left. Average values and standard error of at least three biological replicates are shown in the graphs. * P-value < 0.05; **P < 0.005; ***P < 0.0005; ****P < 0.0001. A total number of 12 technical replicates were considered for Student's t test.

Similar articles

Cited by

References

    1. Arranz R., Martín-Benito J., Valpuesta J.M.. Structure and function of the cochaperone Prefoldin. Prefoldins: The New Chaperones. 2018; 119–131. - PubMed
    1. Chávez S., Puerto-Camacho P.. Prefoldins. eLS. 2016; Chichester, UK: John Wiley & Sons Ltd; 1–8.
    1. Lundin V.F., Leroux M.R., Stirling P.C.. Quality control of cytoskeletal proteins and human disease. Trends Biochem Sci. 2010; 35:288–297. - PubMed
    1. Millán-Zambrano G., Chávez S.. Nuclear functions of prefoldin. Open Biol. 2014; 4:630–642. - PMC - PubMed
    1. Boulon S., Bertrand E., Pradet-Balade B.. HSP90 and the R2TP co-chaperone complex: Building multi-protein machineries essential for cell growth and gene expression. RNA Biol. 2012; 9:148–154. - PubMed

Publication types