. 2021 Jun 21;49(11):6144-6164.
doi: 10.1093/nar/gkab448.

The conserved sex regulator DMRT1 recruits SOX9 in sexual cell fate reprogramming

Affiliations

The conserved sex regulator DMRT1 recruits SOX9 in sexual cell fate reprogramming

Robin E Lindeman et al. Nucleic Acids Res. .

Abstract

Mammalian sexual development commences when fetal bipotential progenitor cells adopt male Sertoli (in XY) or female granulosa (in XX) gonadal cell fates. Differentiation of these cells involves extensive divergence in chromatin state and gene expression, reflecting distinct roles in sexual differentiation and gametogenesis. Surprisingly, differentiated gonadal cell fates require active maintenance through postnatal life to prevent sexual transdifferentiation and female cell fate can be reprogrammed by ectopic expression of the sex regulator DMRT1. Here we examine how DMRT1 reprograms granulosa cells to Sertoli-like cells in vivo and in culture. We define postnatal sex-biased gene expression programs and identify three-dimensional chromatin contacts and differentially accessible chromatin regions (DARs) associated with differentially expressed genes. Using a conditional transgene we find DMRT1 only partially reprograms the ovarian transcriptome in the absence of SOX9 and its paralog SOX8, indicating that these factors functionally cooperate with DMRT1. ATAC-seq and ChIP-seq show that DMRT1 induces formation of many DARs that it binds with SOX9, and DMRT1 is required for binding of SOX9 at most of these. We suggest that DMRT1 can act as a pioneer factor to open chromatin and allow binding of SOX9, which then cooperates with DMRT1 to reprogram sexual cell fate.


Figures

Figure 1.
Figure 1.
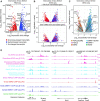
Postnatal sex-biased gonadal gene expression, chromatin accessibility, transcription factor binding and chromatin architecture. (A) Plot of RNA-seq data comparing expression differences between postnatal granulosa and Sertoli cells isolated at P23-29 and P7, respectively. mRNAs with significant expression differences are colored red (granulosa-biased) or blue (Sertoli-biased). X axis indicates the log2 fold change in expression between the cell types and Y axis corresponds to the –log10 of the Benjamini–Hochberg corrected P-value such that genes with greater statistical significance are higher on this plot. (BC) Plots of ATAC-seq data comparing chromatin accessibility between postnatal granulosa and Sertoli cells. Genomic regions that had a two-fold change in accessibility, a Benjamini-Hochberg adjusted P-value <0.05 and a peak-width normalized FPKM value >2.5, or constitutive regions called in both cell types with a fold-change less than 1.25 and an FPKM >2.5 in both cell types are shown. Axes represent the fold-change and significance as in (A). Granulosa-biased differentially accessible regions (DARs) have negative log2 values and Sertoli-biased DARs have positive values (X axis). In (B), genomic regions within 5 kilobases (kb) or between 5 and 100 kb of a sex-biased gene are shown in the upper or lower panels respectively. In (C), colors identify DARs bound by DMRT1 and/or SOX9 in Sertoli cells and FOXL2 and ESR2 in the ovary, based on ChIP-seq analysis. DARs labeled with ‡ and † correspond to the peaks labeled in panel D. (D) Genomic analysis of regions near Sox9 (left), Esr2 (center), and Foxl2 (right), showing sex-biased ATAC-seq accessibility and transcription factor ChIP-seq. The scale shown at right of each track indicates the number of reads per million reads sequenced for the full height of the track. The locations of DARs and ChIP peaks are indicated by a line underneath each peak for visibility. Prenatal ChIP-seq and ATAC-seq data are from Krentz et al. (42) and Garcia-Moreno et al. (6) respectively. Note that fetal ATAC-seq signal around TESCO in both sexes (labeled with *) is thought to derive in part from reporter transgene used in cell sorting (38). Coordinates in the GRCm38 genome build are shown at the top of each panel and gene models are diagrammed at bottom.
Figure 2.
Figure 2.
Motifs enriched in ChIP-seq and ATAC-seq analysis. (A) Motif enriched in FOXL2 and ESR2 ChIP-seq in adult ovary defined by MEME (upper in each) and reference motif from JASPAR (bottom in each). Each motif was ranked as the top motif in their respective MEME searches and the E-value scores were 1.8e–341 and 3.3e–466 for FOXL2 and ESR2 respectively. (B) Motifs enriched in DMRT1 and SOX9 P7 Sertoli cell ChIP-seq above reference motifs from Murphy et al. (64) and JASPAR. Each motif was ranked as the top motif in their respective MEME searches and the E-value scores were 2.6e-806 and 7.4e–711 for DMRT1 and SOX9 respectively. All four motifs were aligned to show the similarity between the DMRT1 and SOX9 motifs. (C) NR5A2-like motif enriched in Sertoli cell ATAC-seq DARs (upper) that were not bound by SOX9 or DMRT1 and the reference NR5A2 motif from JASPAR (lower). This motif was the third ranked motif in the MEME search (E-value = 3.9e–084) but had the highest score when the top three motifs were used to search the JASPER_2018 non-redundant database using TOMTOM (E-value = 3.2e–6).
Figure 3.
Figure 3.
Identification of putative Sertoli regulatory elements. Expression, chromatin accessibility, binding of DMRT1 and SOX9, enrichment of H3K27ac and presence of DMRT1, SOX9, and NR5A1 DNA binding motifs in the underlying genomic sequence are shown for constitutively open regions or Sertoli-biased DARs that are located within 1kb of differentially expressed mRNAs. Heatmaps show ±2 kb from the center of the ATAC-seq peak. The constitutively accessible regions (grey and green traces) and Sertoli-biased DARs (red and blue traces) were each separated into two groups based on whether they were near a granulosa-biased transcript (grey and orange traces) or a Sertoli-biased transcript (green and blue traces). Heatmaps at bottom indicate enrichment scale for each feature. Motif heatmaps for DMRT1, SOX9 and NR5A1 show the locations of motifs that have a score ≥85%, ≥85% and ≥90% of the highest possible score for each motif respectively.
Figure 4.
Figure 4.
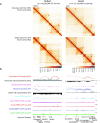
Three dimensional genome organization in female and male somatic cells. Hi-C contact maps at 5kb resolution (A) and one-dimensional tracks (B) for postnatal granulosa cells (p23) and Sertoli Cells (p7). The left hand column shows a region ∼1 Mb surrounding the granulosa expressed gene Nr5a2. The right hand column shows ∼1.6 Mb surrounding the Sertoli expressed gene Sox9. Enriched off-diagonal contacts for granulosa cells or Sertoli cells using 10kb or 25kb binning of the contact maps are shown above the diagonal as magenta or blue boxes respectively. The intensity of the 3D contacts, normalized using the iterative balancing algorithm in cooler, is shown below the contract matrices. An unobstructed view of the data is shown below the diagonal. The promoters for Nr5a2 and Sox9, shown in (A) as red or blue dots on the diagonal respectively, are at domain boundaries in the permissive cell state. On the Sox9 contact map, the positions of ∼600 kb upstream enhancer located within the XYSR region (Enh13; (38)) is shown as a pair of arrowheads in the contact map and a single arrowhead below the tracks. One dimensional representations of the enriched off-diagonal contacts, A/B compartment calculated from the maps, ATAC-seq, ChIP-seq data for FOXL2, ESR2, DMRT1 and SOX9, and genomic features are shown in panel (B).
Figure 5.
Figure 5.
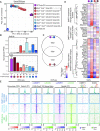
SOX8/9 contribute to sexual reprogramming by DMRT1 in vivo. (A) PCA analysis of 890 granulosa-biased genes and 872 Sertoli-biased genes in whole gonad transcriptome samples, examining Sox8/9 contribution to DMRT1 reprogramming. The variance across all 1762 genes was used to calculate the principal components. PC1 reflects sexual differentiation and PC2 mainly reflects germ cell gene expression. Colors and paired digits inside circles indicate number of intact Sox8 and Sox9 alleles, respectively, as indicated in key. (B) Dependence of Defb36 and Foxl2 mRNA expression on DMRT1 and SOX8/9. The genotype of the Sox8 and Sox9 loci are indicated below the plot and are shaded from a wild-type ovary profile on the left (magenta) to a wild-type testis on the right (navy blue) as in panel A. Error bars represent the standard error of the mean for each genotype. (C) Venn diagram showing proportions of genes affected by ectopic DMRT1 expression primarily when Sox8/9 are intact (solid circle), primarily when they are missing (dashed circle), or regardless of Sox8/9 status (overlap). (D) Heat map showing postnatal expression in ovary, testis, and CAG-Dmrt1 XX gonads of mRNAs implicated in fetal somatic sex differentiation, using same genotype comparisons as panel C. An asterisk above the heatmap represents a greater than two-fold change in expression, an adjusted P-value less than 0.05 and mean count greater than 50 reads. n.s., not significant. (E) ATAC-seq analysis of isolated granulosa and Sertoli cells and ChIP-seq analysis of DMRT1 and SOX9 binding in CAG-Dmrt1 expressing XX gonads, isolated Sertoli cells or adult testis. The locations of consensus DNA binding motifs for DMRT1 and SOX9 are also shown. Genomic regions were classified based on whether they were bound by DMRT1 (dark blue boxed panels and enrichment traces), SOX9 (green) or both DMRT1 and SOX9 (light blue). A random sample of 287 regions of the 3295 regions bound by DMRT1 alone or 2616 regions bound by both DMRT1 and SOX9 while all of the 287 regions bound by SOX9 alone are shown.
Figure 6.
Figure 6.
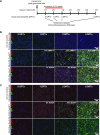
In cultured granulosa cells ectopic DMRT1 upregulates SOX9 expression but ectopic SOX9 does not upregulate DMRT1. (A) Diagram of culture and Tx treatment of primary granulosa cells. (B) Ectopic DMRT1 expression. Top row: Control cells lacking the CAG-CreER transgene, showing lack of GPF or DMRT1 when treated with Tx. Middle row: Granulosa cells carrying both CAG-Dmrt1 and CAG-CreER, showing expression of both GFP (green) and DMRT1 (red) within one day of Tx treatment and increasing proportion of DMRT1-positive cells with time. Bottom row: DMRT1-expressing granulosa cells, showing expression of SOX9 by 1–2 DPTx and increasing proportion of SOX9-positive with time. (C) Top row: Control granulosa cells lacking CAG-CreER, showing lack of GPF or SOX9 expression after Tx treatment. Middle row: Granulosa cells carrying both CAG-SOX9 and CAG-CreER, showing expression of SOX9 and GFP, SOX9-positive cells detected by one day after Tx treatment, increasing in proportion with time. Bottom row: SOX9-expressing granulosa cells, showing lack of DMRT1 expression even at 6 DPTx. Scale bars in (B) and (C) represent 100 um. Data shown are from one of three independent experiments giving very similar results.
Figure 7.
Figure 7.
Reprogramming of sex-biased gene expression by DMRT1 and SOX9 in cultured granulosa cells. (A) Expression of Dmrt1 (top) and Sox9 (bottom) mRNAs in granulosa cells ectopically expressing DMRT1 or SOX9. Expression of Dmrt1 and Sox9 in freshly isolated granulosa (- DPTx) or freshly isolated Sertoli cells (dark blue bars) is also shown for comparison. Normalized FPKMs are shown for control (shaded grays), CAG-Dmrt1 (shaded blues) and CAG-Sox9 (shaded greens). Error bars represent the standard error of the mean at each timepoint for each of the genotypes. (B) PCA analysis of gene expression in cultured wild-type granulosa cells compared to granulosa cells expressing DMRT1 or SOX9. The 500 genes with the highest variance across the transcriptome were used to calculate the principal components. The symbol shapes represent the timepoint of the cultured granulosa cells as follows: 0 DPTx (circles), 1 DPTx (diamonds), 2 DPTx (squares) and 6 DPTx (triangles). (C) Enrichment plots showing effect of DMRT1 (top panels) and SOX9 (bottom panels) expression on Sertoli-biased (left panels) and granulosa-biased (right panels) mRNAs. The t statistic was used to rank the genes from the most significantly upregulated (left-hand side) to the most significantly downregulated (right-hand side) at 6 DPTx. The normalized enrichment score (NES) is shown near the curve for each panel. (D) Sox-dependence of Plppr4 induction by DMRT1 and SOX9 in cultured granulosa cells and in vivo. Colors used in this panel are the same as in previous figures. Error bars represent the standard error of the mean for each genotype.
Figure 8.
Figure 8.
Reprogramming of chromatin accessibility by DMRT1 and SOX9 in cultured granulosa cells. (A) PCA analysis of ATAC-seq data from fetal and postnatal Sertoli and granulosa cells and postnatal granulosa cells ectopically expressing DMRT1 or SOX9. The 500 genomic regions with the highest variance in accessibility were used to calculate the principal components. (B) Venn diagram indicates the degree of overlap in ChIP-seq peaks in granulosa cells expressing CAG-Dmrt1 or CAG-Sox9. DMRT1 ChIP peaks are represented by a blue circle while SOX9 ChIP peaks in CAG-SOX9 granulosa cells (upper) and SOX9 binding in CAG-Dmrt1 granulosa cells (lower) are represented by green circles. (C) ATAC-seq and ChIP-seq data at the Plppr4 locus. The last intron of Plppr4 contains a Sertoli-biased DAR that is bound by DMRT1 and SOX9 in vivo and Dmrt1 expressing granulosa cells but not by SOX9 in Sox9 expressing granulosa cells (red box). A DMRT1-dependent H3K27ac peak (black tracks) is observed in vitro and in vivo. For ATAC-seq and ChIP-seq data, the scale shown at right indicates the number of reads per million reads sequenced for the full height of the track. (D) ATAC-seq and ChIP-seq of Sertoli-biased DARs that have increased accessibility upon expression of CAG-Sox9 or CAG-Dmrt1 in cultured granulosa cells. DARs are sorted based on the ratio of the log2 fold changes in accessibility; regions with greater change in accessibility in CAG-Sox9 expressing cells versus control cells are at the top and greater change in CAG-Dmrt1 expressing cells versus control cells at the bottom. ChIP-seq data for SOX9, DMRT1 and H3K27ac on cultured cells is also shown. Heatmaps at bottom indicate enrichment scale for each feature. ChIP-seq and ATAC-seq experiments were performed at 6 DPTx.
Figure 9.
Figure 9.
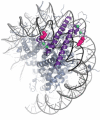
Model of DMRT1 bound to nucleosomal DNA. Molecular model of DMRT1 DM domain structure 4YJ0 (16) bound to DNA in nucleosome 1KX5 (65). Image was made by aligning the C1’ carbons of the nucleotides G9,A12 of strand D and T14,C17 of strand E from DMRT1 with T-38,G-35 from strand J and C35,A38 of strand I of the nucleosome using the pair_fit function in MacPyMOL. Zinc atoms are shown as green spheres and a space-filling model for arginine 72, which inserts into the minor groove, is shown in pink.

Similar articles

Cited by

References

    1. Albrecht K.H., Eicher E.M.. Evidence that Sry is expressed in pre-Sertoli cells and Sertoli and granulosa cells have a common precursor. Dev. Biol. 2001; 240:92–107. - PubMed
    1. Lin Y.T., Capel B.. Cell fate commitment during mammalian sex determination. Curr. Opin. Genet. Dev. 2015; 32:144–152. - PMC - PubMed
    1. Svingen T., Koopman P.. Building the mammalian testis: origins, differentiation, and assembly of the component cell populations. Genes Dev. 2013; 27:2409–2426. - PMC - PubMed
    1. Jameson S.A., Natarajan A., Cool J., DeFalco T., Maatouk D.M., Mork L., Munger S.C., Capel B.. Temporal transcriptional profiling of somatic and germ cells reveals biased lineage priming of sexual fate in the fetal mouse gonad. PLoS Genet. 2012; 8:e1002575. - PMC - PubMed
    1. Stevant I., Kuhne F., Greenfield A., Chaboissier M.C., Dermitzakis E.T., Nef S.. Dissecting cell lineage specification and sex fate determination in gonadal somatic cells using single-cell transcriptomics. Cell Rep. 2019; 26:3272–3283. - PubMed

Publication types