

A genome-scale yeast library with inducible expression of individual genes
- PMID: 34096681
- PMCID: PMC8182650
- DOI: 10.15252/msb.202110207
A genome-scale yeast library with inducible expression of individual genes
Abstract
The ability to switch a gene from off to on and monitor dynamic changes provides a powerful approach for probing gene function and elucidating causal regulatory relationships. Here, we developed and characterized YETI (Yeast Estradiol strains with Titratable Induction), a collection in which > 5,600 yeast genes are engineered for transcriptional inducibility with single-gene precision at their native loci and without plasmids. Each strain contains SGA screening markers and a unique barcode, enabling high-throughput genetics. We characterized YETI using growth phenotyping and BAR-seq screens, and we used a YETI allele to identify the regulon of Rof1, showing that it acts to repress transcription. We observed that strains with inducible essential genes that have low native expression can often grow without inducer. Analysis of data from eukaryotic and prokaryotic systems shows that native expression is a variable that can bias promoter-perturbing screens, including CRISPRi. We engineered a second expression system, Z3 EB42, that gives lower expression than Z3 EV, a feature enabling conditional activation and repression of lowly expressed essential genes that grow without inducer in the YETI library.
Keywords: BAR-seq; CRISPRi; gene overexpression; yeast genomics; yeast mutant array.
© 2021 The Authors. Published under the terms of the CC BY 4.0 license.
Conflict of interest statement
GK, GT, RYW, MH, ES, AB, DB, and RSM are employees of Calico Life Sciences LLC. The remaining authors declare no competing financial interests.
Figures
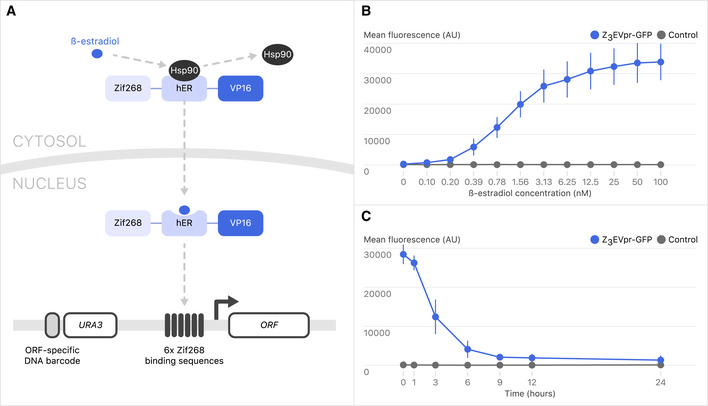
Outline of the β‐estradiol‐inducible gene expression system. Z3EV is composed of a 3‐zinc finger DNA‐binding domain (Zif268), human estrogen receptor domain (hER), and transcription activation domain (VP16). β‐estradiol displaces Hsp90 from the estrogen receptor, allowing Z3EV to translocate to the nucleus and induce gene expression. Zif268 binds preferentially to a sequence that is present in six copies in Z3pr. In the strain collection, gene‐specific DNA barcodes are flanked by universal primer sequences: 5’‐GCACCAGGAACCATATA‐3’ and 5’‐GATCCGCTCGCACCG‐3’.
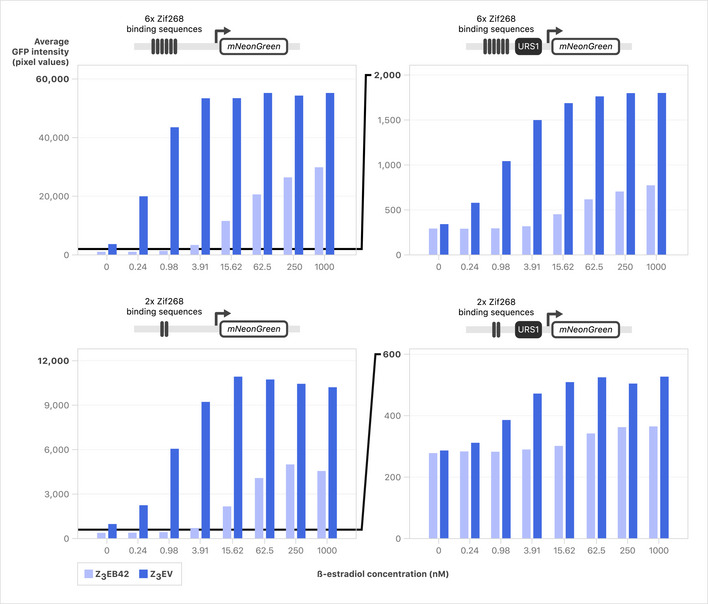
GFP intensity as a function of β‐estradiol concentration. Strains with an integrated Z3pr driving GFP (Y15292; blue) and a control strain (Y15483; gray) were incubated with a concentration series of β‐estradiol in YNB for 6 h, and then cells were fixed. GFP intensity was measured by flow cytometry. Error bars represent standard deviation for three replicates.
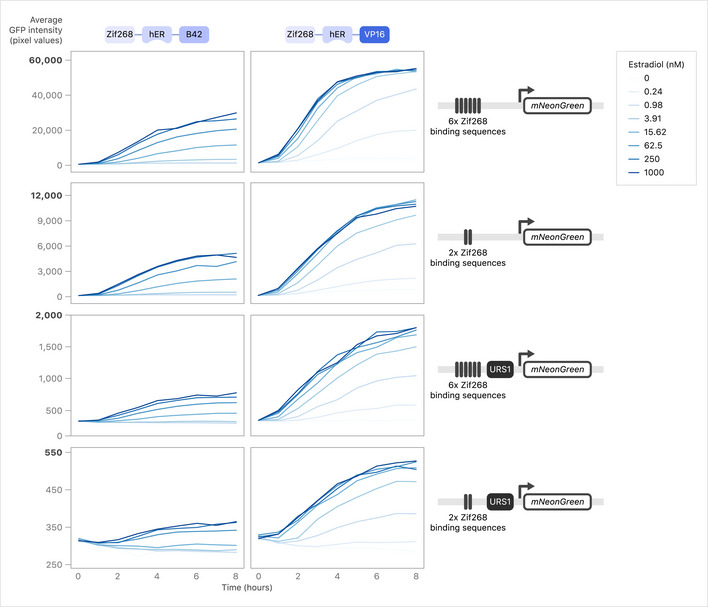
Y15292 (blue) and Y15477 (gray) cultures were induced with 10 nM β‐estradiol for 6 h. Cells were washed, and β‐estradiol was removed from the medium at time = 0 h on the figure. Error bars represent ± 1 standard deviation for three biological replicates.
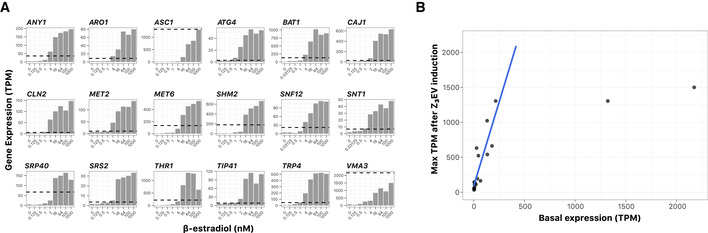
Expression data of 18 strains during exponential growth in 1 ml batch culture of SC medium after 30 min of induction with varying concentrations of β‐estradiol in a deep‐well 96‐well plate. The y‐axis shows transcripts per million (TPM) values from RNA‐seq experiments, and the x‐axis shows concentrations of β‐estradiol (nM). The dotted line indicates the endogenous level of expression for each gene in this experiment, calculated as the average TPM value from all strains in the panel that contain a native copy of the allele.
Comparing Z3EV inducibility to endogenous gene expression. The graph shows maximum TPM values after β‐estradiol induction for the 18 genes assayed in (A) (y‐axis) versus native expression (x‐axis). For genes with maximum endogenous expression level of < 250 TPM, a linear model was fit (y = 87.96 + 4.79x, R 2 = 0.76).
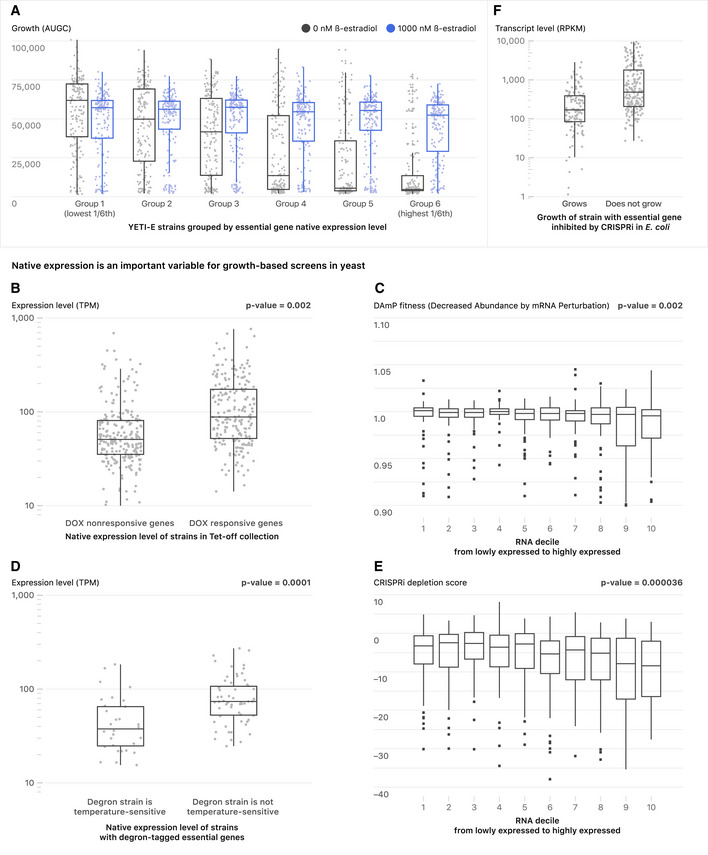
- A
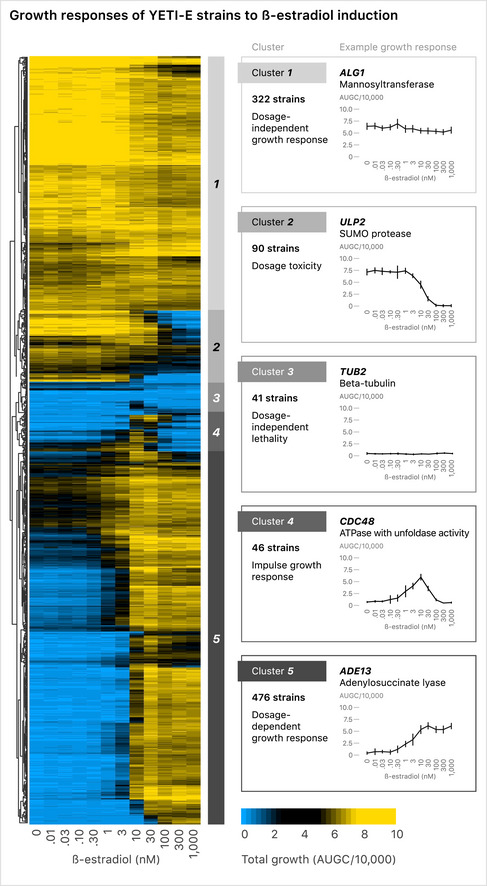
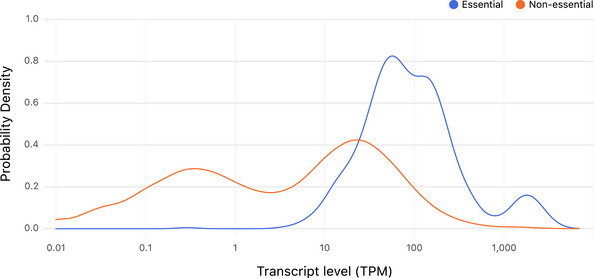
Yeast strains in which Z3EV targets essential genes are more likely to grow in the absence of inducer if the Z3EV‐controlled gene is lowly expressed. The boxplots show YETI‐E AUGC (area under the growth curve) values from 0 nM (gray) and 1,000 nM (blue) β‐estradiol experiments. The six bins (bins 1–6) are based on gene expression level of native genes (Lipson et al, 2009).
- B–F
Box plots showing native levels of gene expression binned by growth characteristics for other yeast strain collections. (B) The TET‐allele collection. Genes not repressible with Tet‐off (DOX‐non‐responsive) and genes that are repressible with Tet‐off (DOX‐responsive) are shown. (C) The DAmP allele collection. Box plots showing fitness of DAmP alleles as a function of native expression level. (D) TS‐degron strains. Levels of native gene expression for genes for which the addition of an N‐terminal degron does not affect growth versus those for which the degron confers temperature‐sensitive growth are plotted. (E) CRISPRi strains. Box plots showing fitness of CRISPRi alleles as a function of native expression level. (F) E. coli strains in which CRISPRi targets essential genes are more likely to grow if the targeted essential gene is lowly expressed. Boxplots show the distribution of gene expression levels for E. coli genes tested in a CRISPRi screening experiment (Wang et al, 2018). The genes are grouped into essential genes whose repression by CRISPRi inhibits growth (does not grow) or fails to inhibit growth (grows). Gene expression data from Gene Expression Omnibus (
GSE67218 ). RPKM (Reads Per Kilobase of transcript, per Million reads) median values are 166 and 503 for the “Grows” and “Does not grow” classes, respectively. For all box plots, the central band represents the median value. The bottom and top hinges represent the 25 and 75% quantiles, respectively.
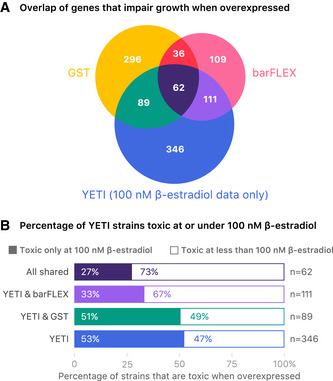
Venn diagram of genes that are toxic upon overexpression from this study as compared to previous overexpression studies.
Barplot of Z3EV toxic strains grouped by overlap with previous overexpression studies seen in (A). For each grouping the percentage of Z3EV toxic strains that are toxic at only 100 nM β‐estradiol (solid color) versus the percentage that are toxic at β‐estradiol concentrations < 100 nM (white) is shown.
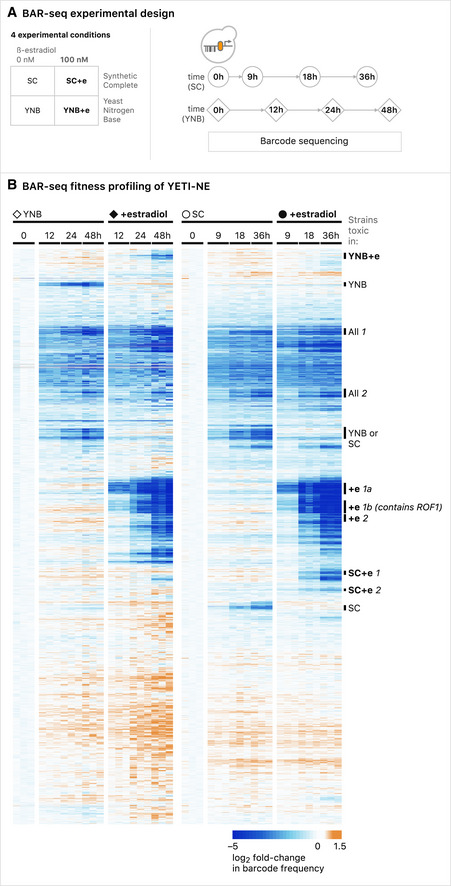
Diagram illustrating the pooled culture growth and harvesting strategy for BAR‐seq experiments with YETI‐NE strains. The labels in the diagram are also used to indicate the relevant growth conditions in the corresponding clustergram (part B).
BAR‐seq analysis of YETI‐NE pools in SC and YNB medium in the absence or presence of 100 nM β‐estradiol. Data were hierarchically clustered and 11 clusters labeled based on conditions in which strains exhibited reduced growth: Cluster YNB +e (showing depletion in 100 nM β‐estradiol in YNB only), Cluster YNB (depletion in 0 nM β‐estradiol in YNB only), Clusters All 1 and All 2 (time‐dependent depletion in all conditions), Cluster YNB or SC (depletion in either YNB or SC at 0 nM β‐estradiol), Clusters “+e 1a” and “+e 1b” (fast depletion in YNB [12 h] and SC [9 h] at 100 nM β‐estradiol), Cluster “+e 2” (depletion by 24 h in YNB and 18 h in SC at 100 nM β‐estradiol), Clusters “SC+e 1” and “SC+e 2” (depletion in SC only at 100 nM β‐estradiol), Cluster SC (depletion in SC only at 0 nM β‐estradiol). Experiments were performed in biological triplicate.
- A
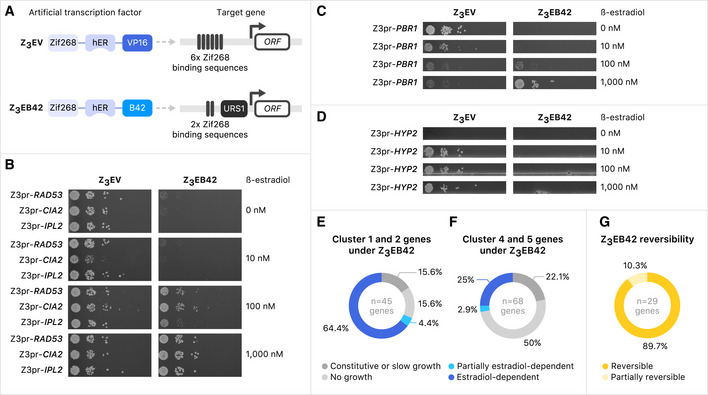
Diagrams of Z3EV artificial transcription factor with Z3pr promoter and Z3EB42 artificial transcription factor with Z3pr‐Zif2‐URS1 promoter.
- B–D
Serial spot dilutions onto medium containing various concentrations of β‐estradiol. Diploid strains containing the indicated regulatory systems (see (A)) controlling the target genes were incubated in sporulation medium for 5 days. Serial dilutions of cells were plated on SD‐his‐ura‐arg‐lys with canavanine, thialysine, and ClonNAT with indicated concentrations of β‐estradiol to obtain haploid cell growth.
- E
Distribution of growth phenotypes for strains carrying Z3EB42 promoter alleles for 45 essential genes from Cluster 1 and 2 (see Fig 2).
- F
Distribution of growth phenotypes for strains carrying Z3EB42 promoter alleles for 68 essential genes from Cluster 4 and 5 (see Fig 2).
- G
Distribution of Z3EB42 promoter reversibility phenotype for 29 tested essential genes.
Similar articles
-
An inducible CRISPR interference library for genetic interrogation of Saccharomyces cerevisiae biology.Commun Biol. 2020 Nov 27;3(1):723. doi: 10.1038/s42003-020-01452-9. Commun Biol. 2020. PMID: 33247197 Free PMC article.
-
Morphological and Transcriptional Responses to CRISPRi Knockdown of Essential Genes in Escherichia coli.mBio. 2021 Oct 26;12(5):e0256121. doi: 10.1128/mBio.02561-21. Epub 2021 Oct 12. mBio. 2021. PMID: 34634934 Free PMC article.
-
Plasmid and Sequencing Library Preparation for CRISPRi Barcoded Expression Reporter Sequencing (CiBER-seq) in Saccharomyces cerevisiae.Bio Protoc. 2022 Apr 5;12(7):e4376. doi: 10.21769/BioProtoc.4376. eCollection 2022 Apr 5. Bio Protoc. 2022. PMID: 35530514 Free PMC article.
-
Mutant power: using mutant allele collections for yeast functional genomics.Brief Funct Genomics. 2016 Mar;15(2):75-84. doi: 10.1093/bfgp/elv042. Epub 2015 Oct 9. Brief Funct Genomics. 2016. PMID: 26453908 Free PMC article. Review.
-
Genetic dissection of histone function.Methods. 1998 Aug;15(4):269-81. doi: 10.1006/meth.1998.0631. Methods. 1998. PMID: 9740715 Review.
Cited by
-
High throughput mutagenesis and screening for yeast engineering.J Biol Eng. 2022 Dec 27;16(1):37. doi: 10.1186/s13036-022-00315-7. J Biol Eng. 2022. PMID: 36575525 Free PMC article. Review.
-
Age-dependent topoisomerase I depletion alters recruitment of rDNA silencing complexes.bioRxiv [Preprint]. 2025 Aug 1:2025.07.29.667507. doi: 10.1101/2025.07.29.667507. bioRxiv. 2025. PMID: 40766557 Free PMC article. Preprint.
-
A Toolkit for Precise, Multigene Control in Saccharomyces cerevisiae.ACS Synth Biol. 2022 Dec 16;11(12):3912-3920. doi: 10.1021/acssynbio.2c00423. Epub 2022 Nov 11. ACS Synth Biol. 2022. PMID: 36367334 Free PMC article.
-
Copy number variation alters local and global mutational tolerance.Genome Res. 2023 Aug;33(8):1340-1353. doi: 10.1101/gr.277625.122. Epub 2023 Aug 31. Genome Res. 2023. PMID: 37652668 Free PMC article.
-
The phosphatase Glc7 controls the eisosomal response to starvation via post-translational modification of Pil1.J Cell Sci. 2023 Jul 15;136(14):jcs260505. doi: 10.1242/jcs.260505. Epub 2023 Jul 24. J Cell Sci. 2023. PMID: 37387118 Free PMC article.
References
Publication types
MeSH terms
Grants and funding
LinkOut - more resources
Full Text Sources
Molecular Biology Databases
