

Pharmacological or genetic inhibition of iNOS prevents cachexia-mediated muscle wasting and its associated metabolism defects
- PMID: 34096686
- PMCID: PMC8261493
- DOI: 10.15252/emmm.202013591
Pharmacological or genetic inhibition of iNOS prevents cachexia-mediated muscle wasting and its associated metabolism defects
Abstract
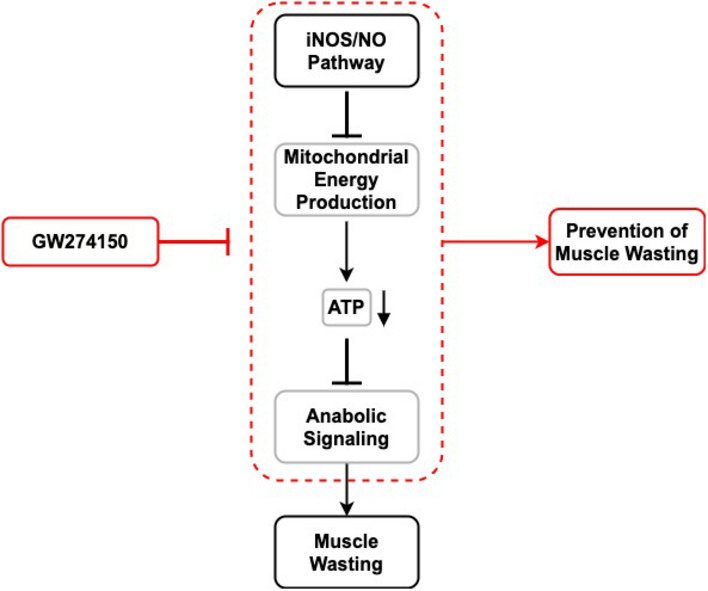
Cachexia syndrome develops in patients with diseases such as cancer and sepsis and is characterized by progressive muscle wasting. While iNOS is one of the main effectors of cachexia, its mechanism of action and whether it could be targeted for therapy remains unexplored. Here, we show that iNOS knockout mice and mice treated with the clinically tested iNOS inhibitor GW274150 are protected against muscle wasting in models of both septic and cancer cachexia. We demonstrate that iNOS triggers muscle wasting by disrupting mitochondrial content, morphology, and energy production processes such as the TCA cycle and acylcarnitine transport. Notably, iNOS inhibits oxidative phosphorylation through impairment of complexes II and IV of the electron transport chain and reduces ATP production, leading to energetic stress, activation of AMPK, suppression of mTOR, and, ultimately, muscle atrophy. Importantly, all these effects were reversed by GW274150. Therefore, our data establish how iNOS induces muscle wasting under cachectic conditions and provide a proof of principle for the repurposing of iNOS inhibitors, such as GW274150 for the treatment of cachexia.
Keywords: cachexia; cancer; iNOS; inflammation; metabolism.
© 2021 The Authors. Published under the terms of the CC BY 4.0 license.
Conflict of interest statement
The authors declare that they have no conflict of interest.
Figures
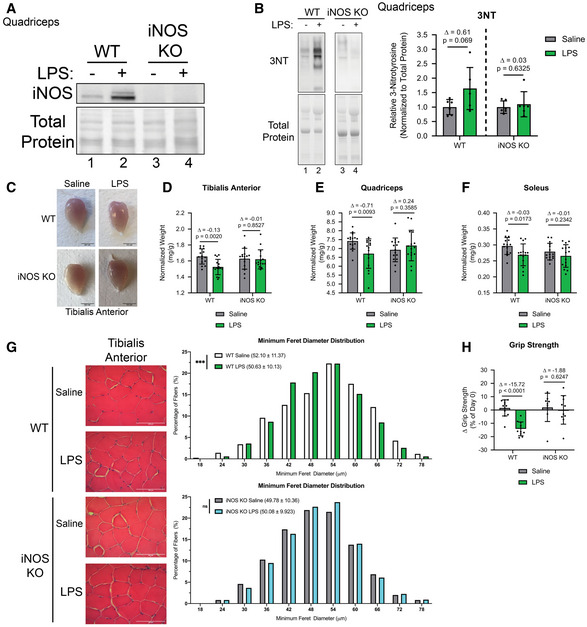
- A
Quadriceps from saline or LPS‐treated, WT, or iNOS KO mice were isolated and used for Western blot analysis with anti‐iNOS (n = 4). Ponceau S was used for total protein staining.
- B
(left) Quadriceps from saline or LPS‐treated, WT, or iNOS KO mice were isolated and used for Western blot with anti‐3NT (n = 6). Total protein levels are also shown. (right) Quantification of the 3NT‐to‐total protein ratio. Ratios are expressed relative to the saline‐treated controls.
- C
Representative images of tibialis anterior muscles. Scale bars represent 0.5 cm.
- D–F
Weight of tibialis anterior (D), quadricep (E), and soleus (F) muscle normalized to initial body weight (n = 15).
- G
(left) Representative photomicrographs of H&E‐stained tibialis anterior muscle sections from control and iNOS KO mice injected with or without LPS. Scale bars = 100 μm. (right) Frequency histogram showing the distribution of muscle fiber minimum Feret diameter in the tibialis anterior muscles from saline‐ or LPS‐treated (top) WT control and (bottom) iNOS KO mice (n = 4). A total of 300 fibers per muscle were used for the analysis. Statistical comparisons, mean, and standard deviation of the mean are shown in the histogram legend.
- H
Change in grip strength between day of injection and endpoint of experiment. (WT saline n = 12, WT LPS n = 11, iNOS KO saline n = 9, and iNOS KO LPS n = 10).
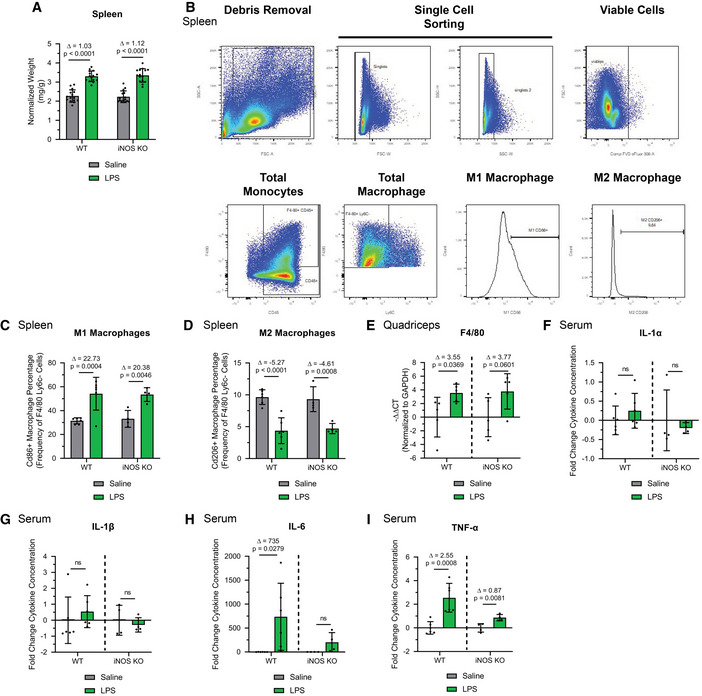
- A
Spleen weight normalized to initial body weight (n = 15).
- B
Gating strategy for flow cytometry analysis of spleen M1 and M2 macrophages.
- C
Percentage of CD86+ M1 splenic macrophages relative to the total F4/80+Ly6C‐ macrophage population (WT saline n = 6, WT LPS n = 6, iNOS KO saline n = 4, and iNOS KO LPS n = 4).
- D
Percentage of CD206+ M2 splenic macrophages relative to the total F4/80+Ly6C‐ macrophage population (WT saline n = 6, WT LPS n = 6, iNOS KO saline n = 4, and iNOS KO LPS n = 4).
- E
Quadriceps from saline or LPS‐treated, WT or iNOS KO mice were isolated and used for RT–qPCR analysis for F4/80 mRNA expression. The – Δ Δ CT was plotted relative to the saline conditions of each background and normalized to GAPDH mRNA levels (n = 5).
- F–I
Serum from saline or LPS‐treated, WT or iNOS KO mice was collected. Fold change in IL‐1α (F), IL‐1β (G), IL‐6 (H), and TNF‐α (I) levels in LPS‐treated mice was plotted relative to saline condition (WT saline n = 6, WT LPS n = 6, iNOS KO saline n = 4, and iNOS KO LPS n = 4).
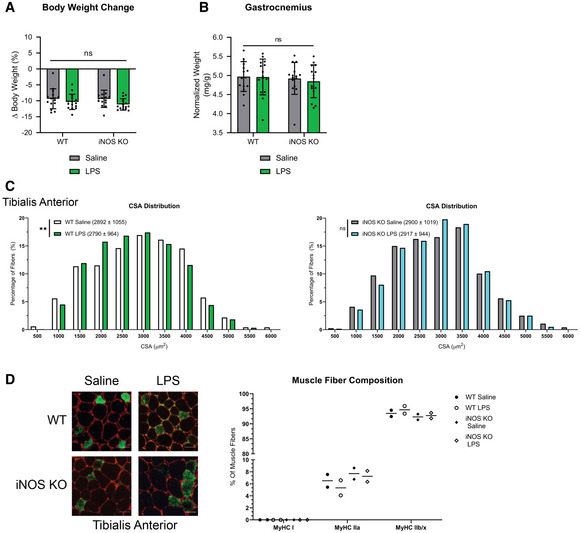
Percent body weight change from time of injection to endpoint of experiment. (n = 15).
Gastrocnemius weight normalized to initial body weight (n = 15).
Frequency histogram showing the distribution of muscle fiber CSA in the tibialis anterior muscles from (left) WT control and (right) iNOS KO mice (n = 4). A total of 300 fibers per muscle were used for the CSA analysis. Statistical comparisons, mean, and standard deviation of the mean are shown in the histogram legend.
(left) Photomicrographs of immunofluorescence images of tibialis anterior muscle sections from WT control and iNOS KO mice injected with or without LPS. Sections were stained against MyHC I (Blue), MyHC IIa (Green), and laminin (Red). Unstained fibers were classified as MyHC IIb/x. Scale bars = 50 μm. (right) Percentage of type I, type IIa, and type IIb/IIx fibers in the whole tibialis anterior muscles from control and iNOS KO mice (n = 2).
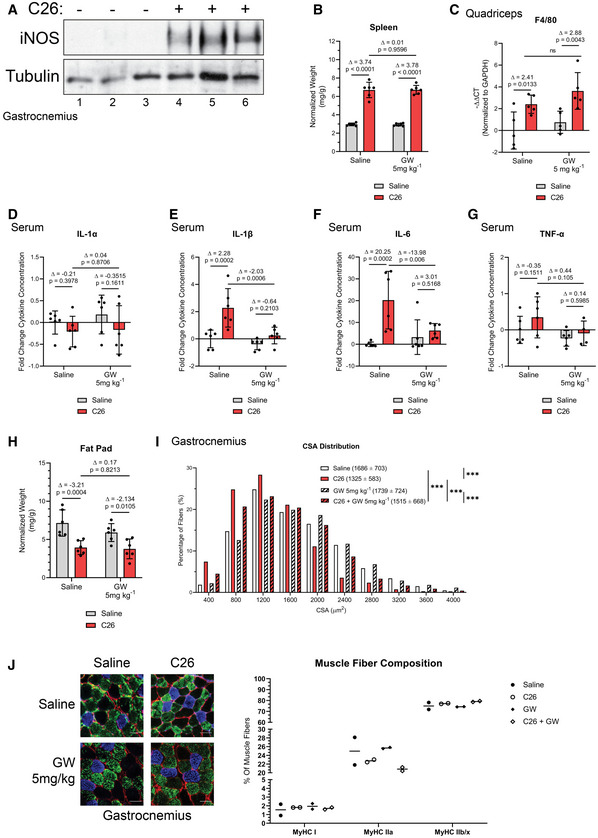
- A
iNOS and tubulin (loading control) protein levels in the gastrocnemius muscle were assessed by Western blot (n = 3).
- B
Spleen weight normalized to initial body weight.
- C
Quadriceps from control and C26 mice treated with or without GW were isolated and used for RT–qPCR analysis for F4/80 mRNA expression. The – Δ Δ CT is plotted relative to the saline condition and normalized to GAPDH mRNA levels (n = 5).
- D–G
Serum from saline and C26‐tumor‐bearing mice treated with or without GW was collected. Fold change in IL‐1α (D), IL‐1β (E), IL‐6 (F), and TNF‐α (G, n = 4 for C26 + GW) levels was plotted relative to saline condition.
- E
Inguinal fat pad weight normalized to initial body weight.
- F
Frequency histogram showing the distribution of muscle fiber CSA in the gastrocnemius muscles from control and C26 mice treated with or without GW (saline n = 4, C26 n = 4, GW 5 mg/kg n = 3, and C26 GW 5 mg/kg n = 4). A total of 600–700 fibers per muscle were used for the CSA analysis. Statistical comparisons, mean, and standard deviation of the mean are shown in the histogram legend.
- G
(left) Photomicrographs of immunofluorescence images of gastrocnemius muscle sections from control and C26 mice treated with or without GW. Sections were stained against MyHC I (Blue), MyHC IIa (Green), and laminin (Red). Unstained fibers were classified as MyHC IIb/x. Scale bars = 50 μm. (right) Percentage of type I, type IIa, and type IIb/IIx fibers in the whole gastrocnemius muscles from control and C26 mice treated with or without GW (n = 2).
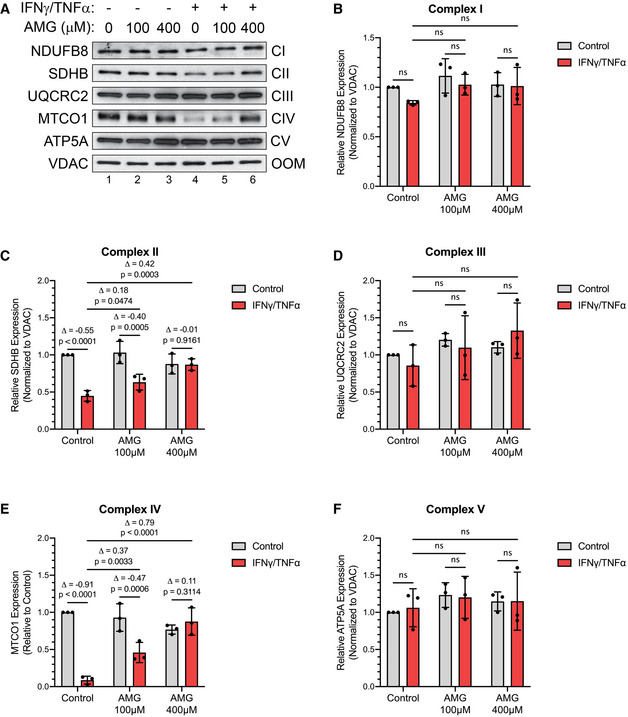
- A
Western blot analysis for ETC protein complex subunits.
- B–F
Quantification of complex subunits normalized to VDAC (outer mitochondrial membrane; OMM) and relative to untreated control. (B) NDUFB8 (complex I; CI), (C) SDHB (complex II; CII), (D) UQCRC2 (complex III; CIII), (E) MTCO1 (complex IV; CIV), and (F) ATP5A (complex V; CV).
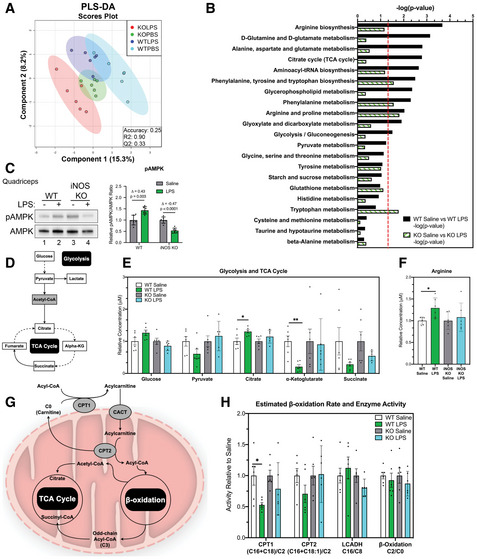
Scores scatter plot of partial least square discriminant analysis (PLS‐DA) model of metabolites from WT and iNOS KO mice treated with or without LPS. Metabolomic data were range‐scaled and mean‐centered.
Pathway analysis using MetaboAnalyst 4.0 Software comparing significantly altered pathways from WT saline to LPS as well as iNOS KO saline to LPS. Pathways are ranked by their significance and filtered based on a Pathway Impact Score > 0.1. Metabolomic data were range‐scaled and mean‐centered. P‐values were obtained using GlobalTest, and the −log(P‐value) corresponding to a P‐value of 0.05 is indicated by the red dashed line.
(left) Western blot analysis of pThr172‐AMPK (pAMPK) and total AMPK (AMPK) in quadriceps muscle. (right) Quantification of the pAMPK‐to‐AMPK ratio. Ratios are expressed relative to the saline‐treated controls.
Schematic of glycolysis and the TCA cycle. White boxes denote detected metabolites. Gray boxes denote undetected metabolites. Dashed arrows indicate the presence of multiple reactions between metabolites.
Relative concentrations of metabolites involved in glycolysis and TCA cycle.
Relative concentration of arginine.
Schematic of acylcarnitine metabolism. Gray circles denote key enzymes involved in metabolic processes highlighted.
Relative estimated activity of CPT1, CPT2, LCADH, and β‐oxidation.
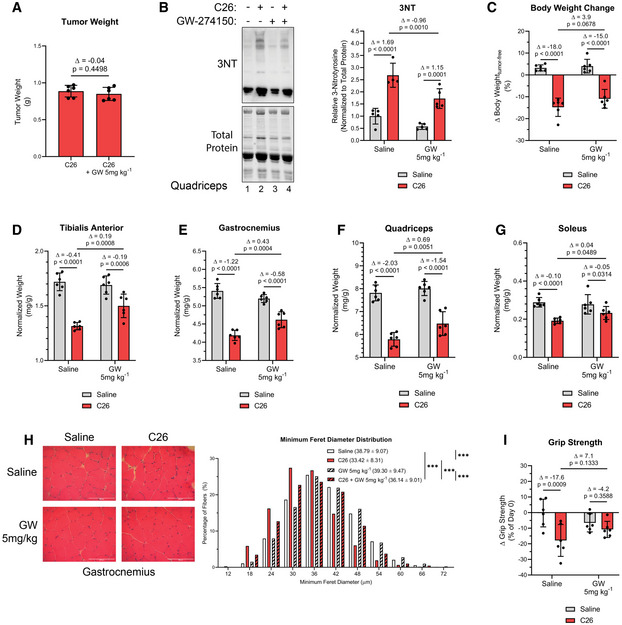
- A
Effect of GW on tumor weight.
- B
(left) Representative image of Western blot analysis of 3NT staining and stain free imaged total protein levels from quadriceps muscle. (right) Quantification of the 3NT‐to‐total protein ratio (saline n = 5, C26 n = 4, GW 5 mg/kg n = 5, and C26 GW 5 mg/kg n = 5).
- C
Percent body weight change from day 0 to day 16.
- D–G
Weight of tibialis anterior (D), gastrocnemius (E), quadricep (F), and soleus (G) muscle normalized to initial body weight.
- H
(left) Representative photomicrographs of gastrocnemius muscle sections from control and C26 mice treated with or without GW taken after H&E staining. Scale bars = 100 μm. (right) Frequency histogram showing the distribution of muscle fiber minimum Feret diameter in the gastrocnemius muscles from control and C26 mice treated with or without GW (saline n = 4, C26 n = 4, GW 5 mg/kg n = 3, and C26 GW 5 mg/kg n = 4). A total of 600‐700 fibers per muscle were used for the analysis. Statistical comparisons, mean, and standard deviation of the mean are shown in the histogram legend.
- I
Change in grip strength from before tumor cell injection (day 0) and before endpoint collection (day 16).
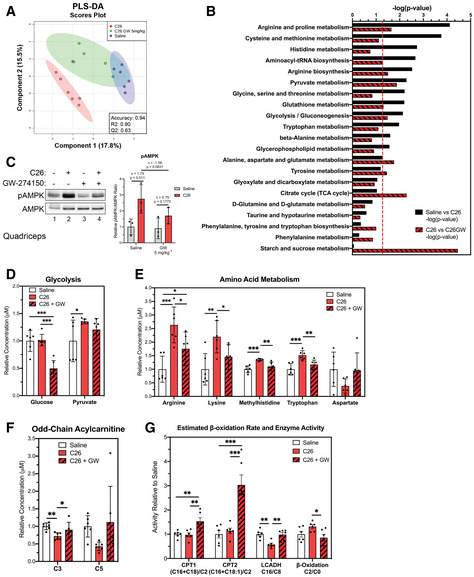
Scores scatter plot of partial least square discriminant analysis (PLS‐DA) model of metabolites from saline, C26, and C26 + GW‐treated mice. Metabolomic data were range‐scaled and mean‐centered.
Pathway analysis using MetaboAnalyst 4.0 Software comparing significantly altered pathways from saline to C26 as well as C26 to C26 + GW. Pathways are ranked by their significance and filtered based on a Pathway Impact Score > 0.1. Metabolomic data were range‐scaled and mean‐centered. P‐values were obtained using GlobalTest, and the −log(P‐value) corresponding to a P‐value of 0.05 is indicated by the red dashed line.
(left) Western blot analysis of pThr172‐AMPK (pAMPK) and total AMPK (AMPK) in quadriceps muscle (n = 3). (right) Quantification of the pAMPK‐to‐AMPK ratio relative to the saline‐treated control (n = 3).
Relative concentrations of metabolites involved in glycolysis.
Relative concentrations of amino acids.
Relative concentrations of odd‐chain acylcarnitines.
Relative estimated activity of CPT1, CPT2, LCADH, and β‐oxidation.
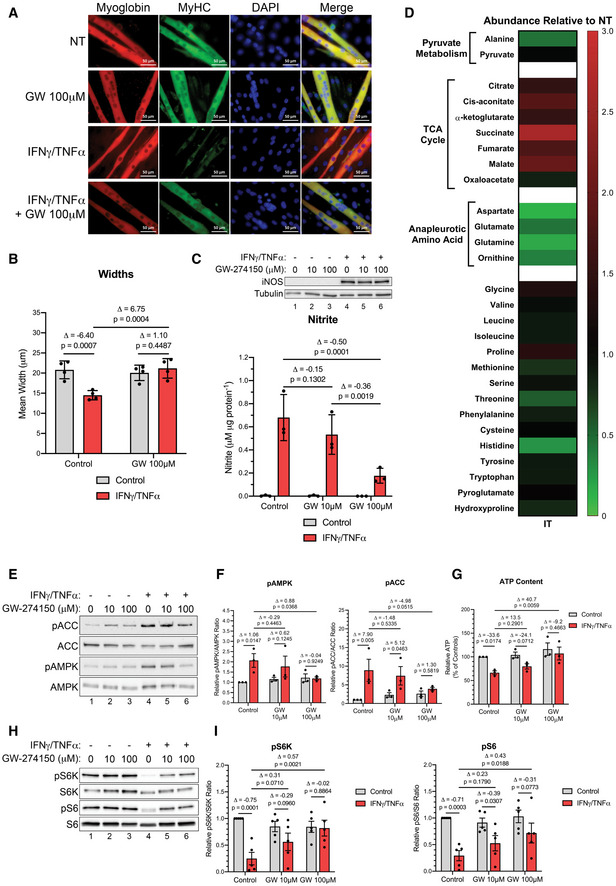
Representative immunofluorescence imaging for myoglobin and myosin heavy chain (MyHC) in not treated (NT) controls and IFNγ/TNF‐α (IT) samples treated with or without GW. Nuclei were visualized with DAPI staining (n = 4).
Quantification of mean fiber widths (n = 4).
(top) Western blot analysis for iNOS and tubulin (n = 3). (bottom) Media nitrite levels (n = 3).
Heatmap visualizing mean concentration corresponding to metabolites of IFNγ/TNF‐α (IT)‐treated samples relative to not treated (NT) controls (n = 3). Red and green indicate an increase or decrease in metabolite levels, respectively.
Western blot analysis for pThr172‐AMPK (pAMPK), total AMPK (AMPK), pSer79‐ACC (pACC), and total ACC (ACC).
Quantification of the pAMPK‐to‐AMPK ratio (left) and the pACC‐to‐ACC ratio (right) relative to the untreated control (n = 3).
Cellular ATP content quantified as a percentage of the untreated control (n = 3).
Western blot analysis for pThr389‐S6K (pS6K), total S6K (S6K), pSer235/236‐S6 (pS6), and total S6 (S6) (n = 5).
Quantification of the (left) pS6K‐to‐S6K ratio and the (right) pS6‐to‐S6 ratio relative to the untreated control (n = 5).
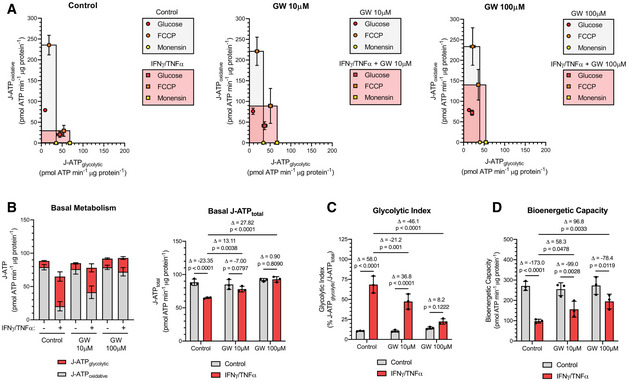
Bioenergetic profiles. Highlighted squares are defined by the theoretical maximal J‐ATPoxidative and J‐ATPglycolytic rates.
(left) Basal J‐ATPglycolytic and J‐ATPoxidative rates. (right) Total basal J‐ATP rate.
Glycolytic index of basal metabolism.
Total bioenergetic capacity.
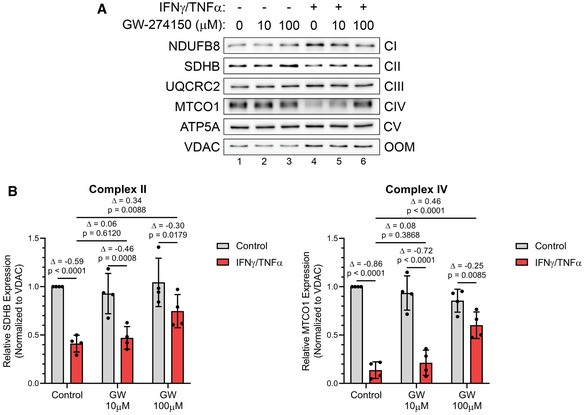
Western blot analysis for ETC protein complex subunits.
(left) Quantification of SDHB (complex II; CII) normalized to VDAC (outer mitochondrial membrane; OMM) and relative to untreated control. (right) Quantification of MTCO1 (complex IV; CIV) normalized to VDAC and relative to untreated control.
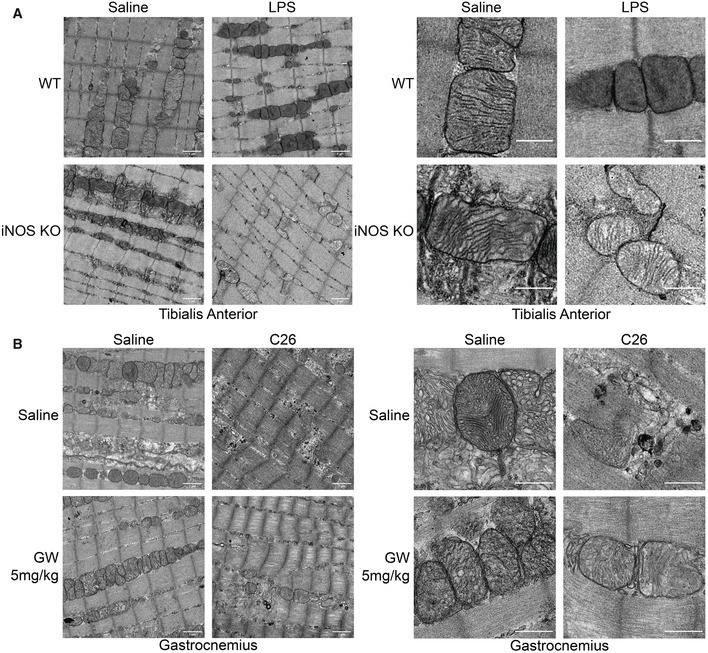
Male C57BL/6 wild‐type (WT) and iNOS knockout (KO) mice were intraperitoneally injected with 1 mg kg−1 LPS or an equivalent volume of carrier solution. Control WT, control KO, and LPS‐treated KO cohorts were pair‐fed (PF) to the WT LPS‐treated cohorts. After 18 h, mice were euthanized, and tibialis anterior muscles were imaged by transmission electron microscopy. (left) Representative micrograph of tibialis anterior muscle (n = 2). Scale bar = 1 µm. (right) Zoomed section of representative image to highlight mitochondria. Scale bar = 0.5 µm.
Male BALB/C mice were injected subcutaneously with C26 cells (1.25 × 10⁶ cells) or an equivalent volume of saline. After 5 days, and everyday thereafter, saline‐ and C26‐injected mice were treated with or without GW (5 mg kg−1). After 16 days, mice were euthanized and gastrocnemius muscles were imaged by transmission electron microscopy. (left) Representative micrograph of gastrocnemius muscle (n = 2). Scale bar = 1 µm. (right) Zoomed section of representative image to highlight mitochondria. Scale bar = 0.5 µm.
Similar articles
-
Inducible nitric oxide synthase (iNOS) in muscle wasting syndrome, sarcopenia, and cachexia.Aging (Albany NY). 2011 Aug;3(8):702-15. doi: 10.18632/aging.100358. Aging (Albany NY). 2011. PMID: 21832306 Free PMC article. Review.
-
2-Deoxy-D-glucose Alleviates Cancer Cachexia-Induced Muscle Wasting by Enhancing Ketone Metabolism and Inhibiting the Cori Cycle.Cells. 2022 Sep 25;11(19):2987. doi: 10.3390/cells11192987. Cells. 2022. PMID: 36230949 Free PMC article.
-
The AMPK agonist 5-aminoimidazole-4-carboxamide ribonucleotide (AICAR), but not metformin, prevents inflammation-associated cachectic muscle wasting.EMBO Mol Med. 2018 Jul;10(7):e8307. doi: 10.15252/emmm.201708307. EMBO Mol Med. 2018. PMID: 29844217 Free PMC article.
-
Cryptotanshinone prevents muscle wasting in CT26-induced cancer cachexia through inhibiting STAT3 signaling pathway.J Ethnopharmacol. 2020 Oct 5;260:113066. doi: 10.1016/j.jep.2020.113066. Epub 2020 Jun 4. J Ethnopharmacol. 2020. PMID: 32505837
-
Targeting Mitochondria and Oxidative Stress in Cancer- and Chemotherapy-Induced Muscle Wasting.Antioxid Redox Signal. 2023 Feb;38(4-6):352-370. doi: 10.1089/ars.2022.0149. Epub 2022 Dec 29. Antioxid Redox Signal. 2023. PMID: 36310444 Free PMC article. Review.
Cited by
-
Disrupted NOS2 metabolism drives myoblast response to wasting-associated cytokines.Exp Cell Res. 2021 Oct 1;407(1):112779. doi: 10.1016/j.yexcr.2021.112779. Epub 2021 Aug 21. Exp Cell Res. 2021. PMID: 34428455 Free PMC article.
-
Effect of Glycyrrhiza uralensis crude water extract on the expression of Nitric Oxide Synthase 2 gene during myogenesis.Heliyon. 2024 Jul 16;10(14):e34747. doi: 10.1016/j.heliyon.2024.e34747. eCollection 2024 Jul 30. Heliyon. 2024. PMID: 39149015 Free PMC article.
-
Metabolomics and its Applications in Cancer Cachexia.Front Mol Biosci. 2022 Feb 7;9:789889. doi: 10.3389/fmolb.2022.789889. eCollection 2022. Front Mol Biosci. 2022. PMID: 35198602 Free PMC article. Review.
-
Etlingera Elatior Inflorescence Extract Mitigates Acute Gastric Ulcers by Suppressing the Expression of Inducible Nitric Oxide Synthase in Ethanol-Induced Wistar Rats.J Exp Pharmacol. 2025 Jun 17;17:343-357. doi: 10.2147/JEP.S524517. eCollection 2025. J Exp Pharmacol. 2025. PMID: 40547510 Free PMC article.
-
Molecular mechanisms of cancer cachexia-related loss of skeletal muscle mass: data analysis from preclinical and clinical studies.J Cachexia Sarcopenia Muscle. 2023 Jun;14(3):1150-1167. doi: 10.1002/jcsm.13073. Epub 2023 Mar 2. J Cachexia Sarcopenia Muscle. 2023. PMID: 36864755 Free PMC article. Review.
References
-
- Adams V, Spate U, Krankel N, Schulze PC, Linke A, Schuler G, Hambrecht R (2003) Nuclear factor‐kappa B activation in skeletal muscle of patients with chronic heart failure: correlation with the expression of inducible nitric oxide synthase. Eur J Cardiovasc Prev Rehabil 10: 273–277 - PubMed
-
- Ahsan H (2013) 3‐Nitrotyrosine: A biomarker of nitrogen free radical species modified proteins in systemic autoimmunogenic conditions. Hum Immunol 74: 1392–1399 - PubMed
-
- Anavi S, Tirosh O (2019) iNOS as a metabolic enzyme under stress conditions. Free Radic Biol Med 146: 16–35 - PubMed
-
- Antunes D, Padrão AI, Maciel E, Santinha D, Oliveira P, Vitorino R, Moreira‐Gonçalves D, Colaço B, Pires MJ, Nunes C et al (2014) Molecular insights into mitochondrial dysfunction in cancer‐related muscle wasting. Biochim Biophys Acta 1841: 896–905 - PubMed
Publication types
MeSH terms
Grants and funding
LinkOut - more resources
Full Text Sources
Medical
Miscellaneous
