. 2021 Aug 3;182(2):310-326.
doi: 10.1093/toxsci/kfab066.

Developmental Exposure to Domoic Acid Disrupts Startle Response Behavior and Circuitry in Zebrafish

Affiliations

Developmental Exposure to Domoic Acid Disrupts Startle Response Behavior and Circuitry in Zebrafish

Jennifer M Panlilio et al. Toxicol Sci. .

Abstract

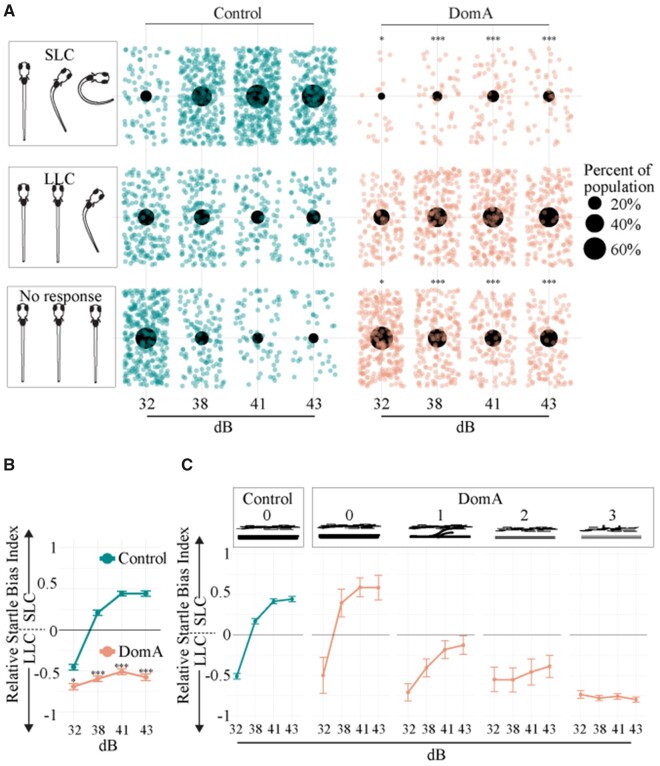
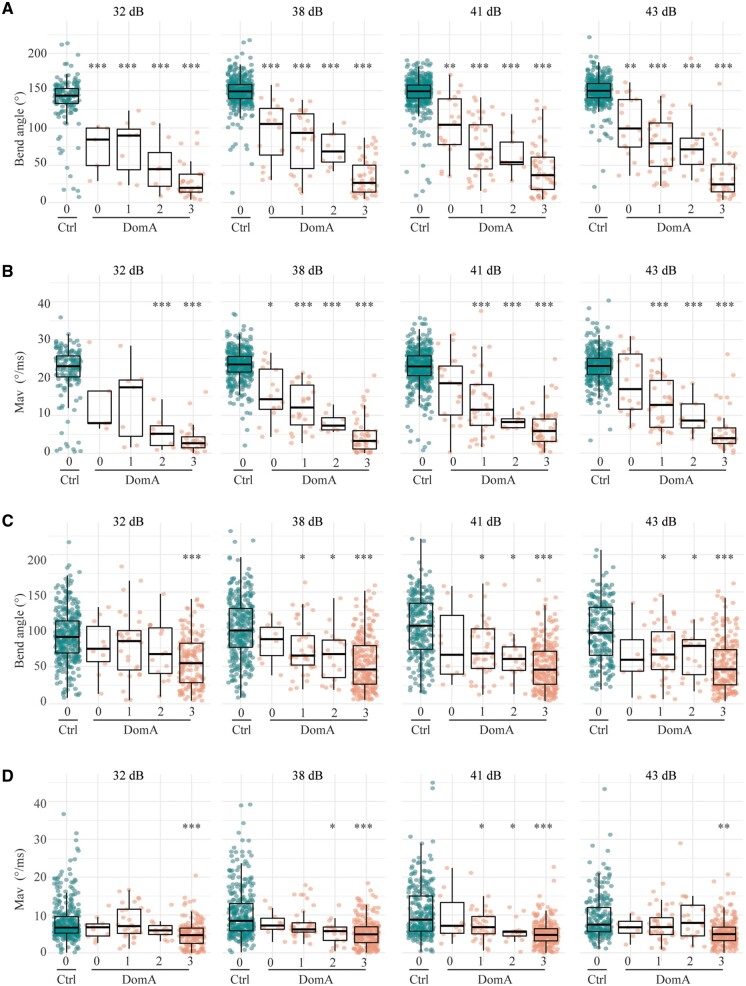
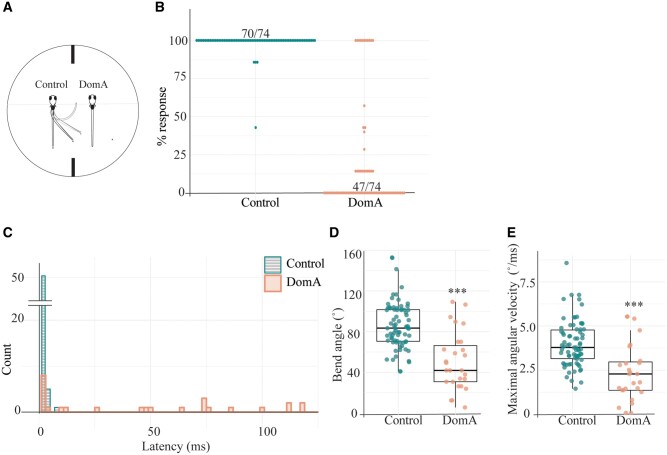
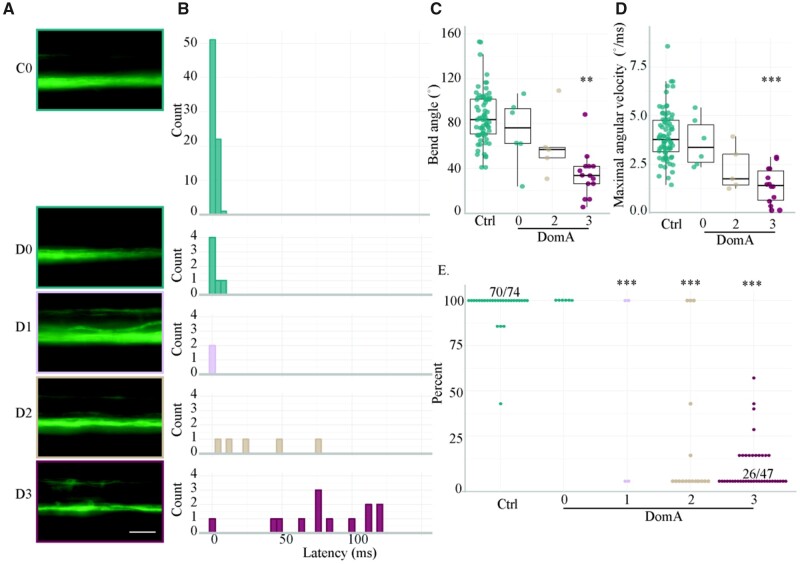
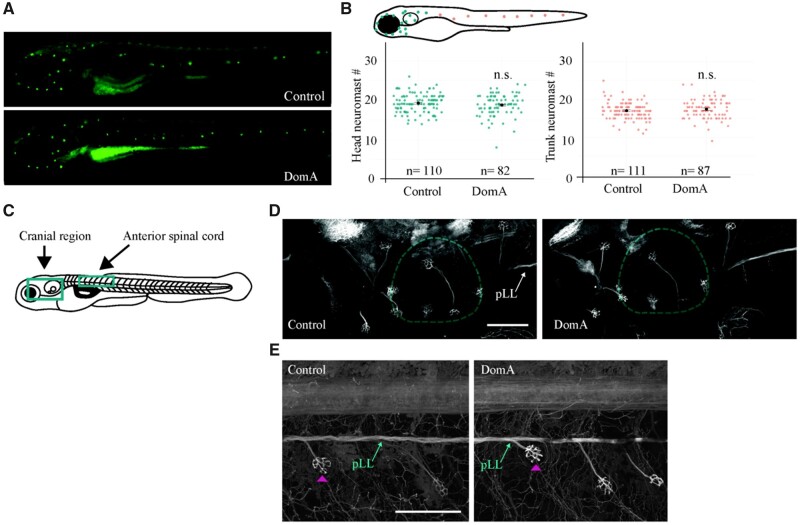
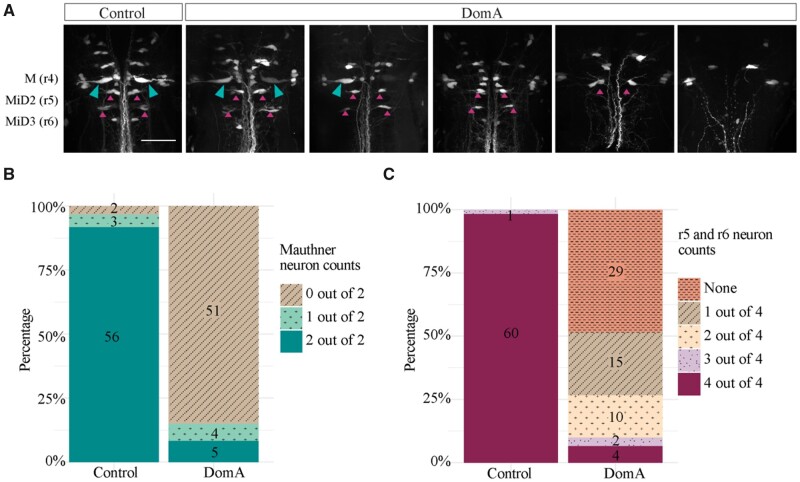
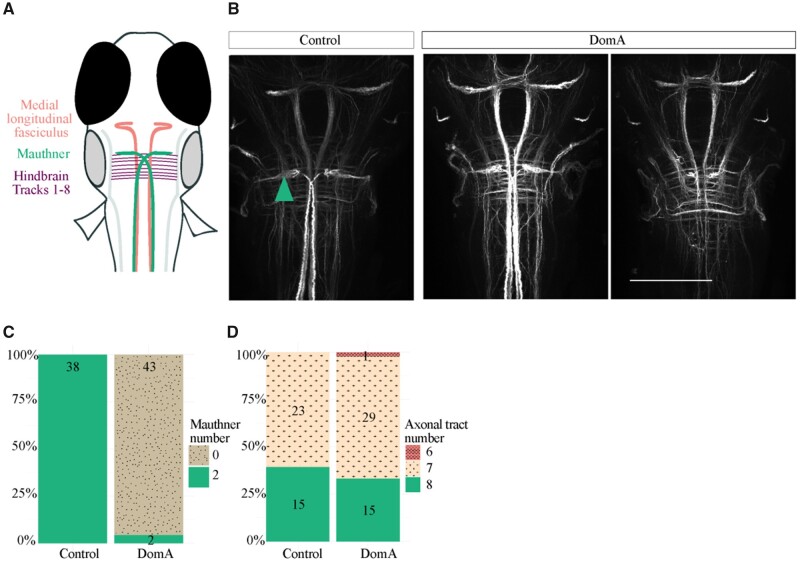
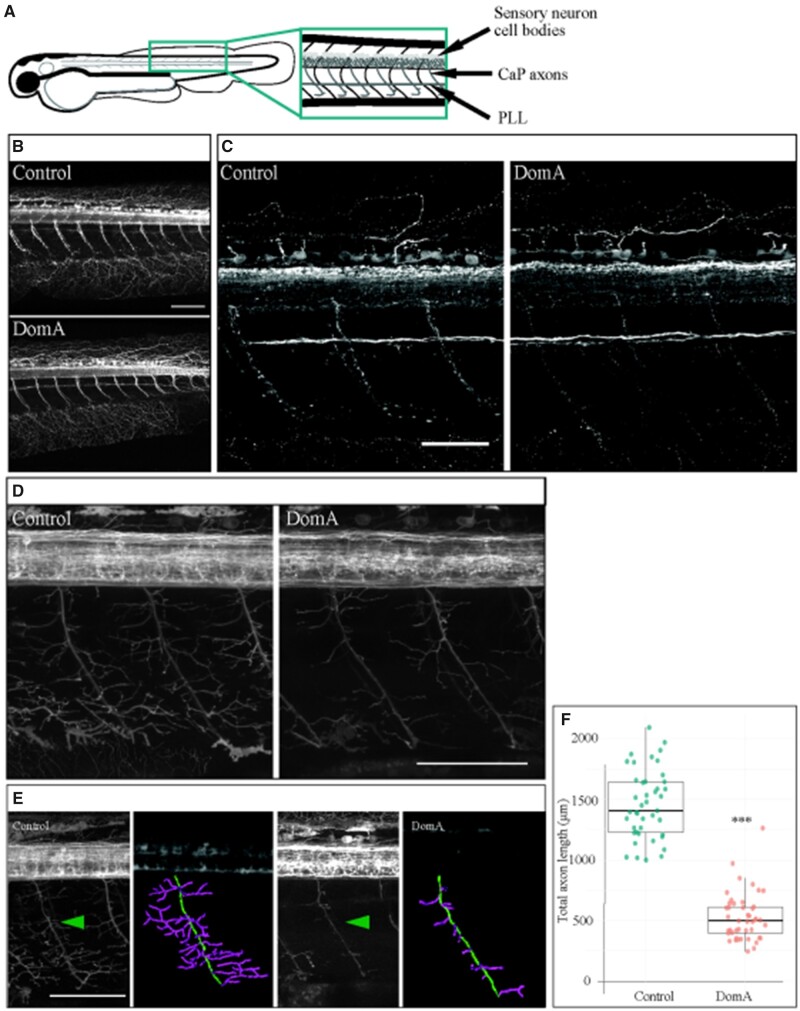
Harmful algal blooms produce potent neurotoxins that accumulate in seafood and are hazardous to human health. Developmental exposure to the harmful algal bloom toxin, domoic acid (DomA), has behavioral consequences well into adulthood, but the cellular and molecular mechanisms of DomA developmental neurotoxicity are largely unknown. To assess these, we exposed zebrafish embryos to DomA during the previously identified window of susceptibility and used the well-known startle response circuit as a tool to identify specific neuronal components that are targeted by exposure to DomA. Exposure to DomA reduced startle responsiveness to both auditory/vibrational and electrical stimuli, and even at the highest stimulus intensities tested, led to a dramatic reduction of one type of startle (short-latency c-starts). Furthermore, DomA-exposed larvae had altered kinematics for both types of startle responses tested, exhibiting shallower bend angles and slower maximal angular velocities. Using vital dye staining, immunolabeling, and live imaging of transgenic lines, we determined that although the sensory inputs were intact, the reticulospinal neurons required for short-latency c-starts were absent in most DomA-exposed larvae. Furthermore, axon tracing revealed that DomA-treated larvae also showed significantly reduced primary motor neuron axon collaterals. Overall, these results show that developmental exposure to DomA targets large reticulospinal neurons and motor neuron axon collaterals, resulting in measurable deficits in startle behavior. They further provide a framework for using the startle response circuit to identify specific neural populations disrupted by toxins or toxicants and to link these disruptions to functional consequences for neural circuit function and behavior.

Keywords: developmental toxicity; domoic acid; escape response; harmful algal bloom toxins; harmful algal blooms; startle circuit; startle response.


Figures

Figure 1.
Figure 1.
Domoic acid-exposed larvae (6 dpf) are less responsive and preferentially perform LLC startles compared with controls when given auditory/vibrational stimuli. A, Distribution of fish that did one of 3 behaviors: (1) no response, (2) LLC startle, or (3) SLC startle for each stimulus intensity. Only the first of the replicate stimuli were graphed so that each fish is represented once. Individual points represent single fish that performed each behavior. Large black dots represent the proportion of the population that performed one of the 3 behaviors within a given stimulus intensity. Asterisks in the no response column represent statistically significant differences in responsiveness in DomA-exposed fish relative to controls within each stimulus intensity. Asterisks in the SLC column represent statistically significant differences in the performance of SLC rather than LLCs in DomA-exposed fish relative to controls within each stimulus intensity. Significance was determined using mixed effects logistic regression. *p < .05, *** p < .001. B, Relative Startle Bias Index was calculated for all fish that were responsive. Individual fish were provided with 4–7 replicate stimuli within a given stimulus intensity. Bias per individual was calculated as the (frequency of SLC—frequency of LLC)/total responses. +1 represents the value in which all responses were SLC-type startles and −1 represents the value in which all were LLC-type startles. Mean behavioral biases for a treatment group per stimulus intensity were graphed. Asterisks indicate statistical significance in performing SLC startles (vs. LLC startles). C, Domoic acid-treated larvae were also classified by myelin category (0–3) in a subset of the experiments (subset of fish graphed in Figure 1B). Startle bias per myelin phenotype was plotted. Abbreviations: DomA, domoic acid; LLC, long-latency c; SLC, short-latency c.
Figure 2.
Figure 2.
Kinematics deficits in auditory/vibrational startle are correlated to myelin defects. A, DomA-treated larvae (6 dpf) were subcategorized by myelin sheath defects. 0 = control-like myelin sheaths to 3 = the most severe myelin defect observed. Bend angles during SLC startles with increasing stimulus intensities. B, Maximal angular velocities (Mav) during SLC startles with increasing stimulus intensities. C, Bend angles during LLC startles with increasing stimulus intensities. D, Maximal angular velocities (Mav) during LLC startles with increasing stimulus intensities. Asterisks represent statistical significance between DomA-exposed fish and controls determined using nonparametric multiple comparison procedures with Dunnett-type contrasts (*p < .05, **p < .001, ***p <.0001).
Figure 3.
Figure 3.
Domoic acid-exposed larvae have aberrant startle responses to direct electrical stimulation. A, Larvae (7 dpf) were head-mounted in agar and positioned rostral-caudally to the electrodes. Control larvae were mounted on the left, DomA-exposed larvae on the right. Larvae were then provided with a 4.4 V/cm, 2-ms square pulse. Their tail movements were captured using a high-speed video camera. B, Percent responsiveness of individual larvae to 7 identical electric field pulses. Points represent the percent of times an individual fish responded to replicate stimuli. 70/74 of the control population responded 100% of the time whereas 47/74 of the DomA-treated population responded 0% of the time. C, Latency distributions for the control and DomA-treated fish. The count represents the number of fish that have latencies within each of the 2 ms time bins. The majority of the control fish responded within 2 ms after the stimulus was produced (51/74 Control fish had a median latency of 1–2 ms). Not shown n = 1 DomA-treated larva that responded at 179 ms. D, Maximal bend angle for control (n = 74) versus DomA-treated fish (n = 27). Each point represents the median response of an individual fish. E, Maximal angular velocity for control versus DomA-treated fish. Each point represents the median response of an individual fish. ***p ≤ .0001 indicates a significant difference between DomA-exposed fish relative to control fish. Statistical significance was determined using a nonparametric Behrens-Fisher t-test.
Figure 4
Figure 4
Severity in myelin defects is correlated with startle kinematic deficits from direct-electric field stimulation. A, Representative widefield epifluoresence images of the myelin sheath phenotypes (imaged at 5–6 dpf) categorized as (0) having no myelin defect to (3) having the most myelin severe defect observed. C0 = Control, D0–D3 = DomA treated. B, Latency distributions for the control and DomA-treated larvae tested at 7 dpf. The same larvae were used in Figure 5C, but further categorized by myelin sheath imaging categories. Not shown = 1 DomA-treated larvae which responded at 179 ms. C, Maximum bend angle for control (n = 74) versus DomA-treated fish (n = 25). Fish with myelin defects in category 1 (D1) were excluded from this analysis due to low sample sizes (n = 2). D, Maximal angular velocity for control versus DomA-treated fish. E, Percent responsiveness of individual larvae to 7 identical electric field pulses. Points represent the percent of times an individual fish responded to replicate stimuli. Ratios listed above a group of points represent the ratio of fish that responded to that stimulus over the total within that percentage bracket. Ratios were listed when all the individual points could not fit on the graph. Asterisks in Figures 4C and 4D represent statistical significance between DomA and controls determined using a nonparametric multiple comparisons test with Dunnett-type intervals. Asterisks in Figure 4E represent statistical significance between DomA and controls using a generalized linear model with a quasibinomial link function followed by post-hoc pairwise Dunnett comparisons (**p ≤ .001, ***p ≤ .0001). Scale bar = 25 μm.
Figure 5.
Figure 5.
The sensory inputs required for the startle response appeared intact in domoic acid-exposed larvae. A–B, DASPEI labeling of sensory neuromasts in 5 dpf larvae. A, Representative widefield fluorescence images of DASPEI-stained control and DomA-exposed larvae. B, Diagram of a 5-dpf larva with head neuromasts colored in teal and trunk neuromasts colored in peach. Head and trunk neuromast counts for control and DomA-exposed. Single points represent individual larvae. The black bar represents the standard error of the mean (SE). For cranial region, control—mean = 19 ± 2 (SD), DomA—mean = 19 ± 3 (SD). For trunk region, control—mean =17, ± 2 (SD), DomA—mean = 17 ± 3 (SD). C–E, Imaging of sensory ganglia in 5 dpf Tg(cntn1b:EGFP-CAAX) larvae. C, Diagram of a laterally mounted Tg(cntn1b:EGFP-CAAX) larva, with green boxes that indicate approximate areas imaged. D, Representative confocal images from the cranial region of laterally mounted Tg(cntn1b:EGFP-CAAX) control (n = 33) and DomA-exposed (n = 45) larvae. Inner ear is outlined in teal. E, Representative confocal images from anterior spinal cord in laterally mounted Tg(cntn1b:EGFP-CAAX) control (left; n = 36) and DomA-exposed (right; n = 47) larvae. Pink arrowhead points to a neuromast. Abbreviation: pLL, peripheral lateral line. Scale bars: 100 μm.
Figure 6.
Figure 6.
The majority of reticulospinal neurons required for startle responses are absent in domoic acid-exposed larvae. A, Larvae (7 dpf) were backfilled with Texas Red dextran through spinal cord transections. The figures represent the range of phenotypes observed in control and DomA-injected fish. The teal arrows mark the Mauthner cells and magenta arrows mark backfilled neurons in rhombomere 5 (r5) and rhombomere 6 (r6). B, Mauthner cells on the 2 lateral sides were scored per fish. A majority of DomA-exposed fish (identified 51 out of 60) did not have any Mauthner (M) cells. C, Other reticulospinal neurons involved in startle responses (MiD2cm, MiD3) are located in r5 and r6. The presence of any neuron backfilled in r5 and r6 on the 2 lateral sides was scored. A majority of DomA-exposed fish had one or no neurons that were backfilled in r5 and r6 (44 out of 60). Scale bar = 50 μm.
Figure 7.
Figure 7.
The majority of DomA-exposed larvae do not have Mauthner cells but have other hindbrain and midbrain structures. A, Schematic of brains stained with α-3A10, which labels for the Mauthner cells, medial longitudinal fasciculus, and hindbrain axonal tracts. B, Representative images of brains from control and DomA-exposed larvae (5 dpf) stained with α-3A10. Teal arrow points to Mauthner cell. Scale bar = 100 μm. C, Score of the number of Mauthner cells (0–2) present in control and treated larvae. Numbers within each section represent the number of larvae with the given phenotype. D, Score of the number of hindbrain axonal tracts detectable in control and treated larvae. Numbers within each section represent the number of larvae with the given phenotype.
Figure 8.
Figure 8.
Domoic acid exposure reduces axon collateral branching in caudal primary motor neurons. A–C, Immunostaining for acetylated tubulin in 2.5 dpf embryos. A, Diagram of a 2.5 dpf embryos laterally mounted and immunostained with α-acetylated tubulin. Anatomical features of interest are highlighted. B, Immunostaining with α-acetylated tubulin at 2.5 dpf. DomA-exposed embryos (n = 34) had visible CaP axons, sensory neuron cell bodies, and PLLs that were indistinguishable from controls (n = 31). C, Higher-resolution image of control and DomA-exposed fish immunostained with α-acetylated tubulin. D–F, Imaging of primary motor neuron branching in 2.5 dpf Tg(cntn1b:EGFP-CAAX) embryos. D, Representative images from 2.5 dpf Tg(cntn1b:EGFP-CAAX) controls and DomA-exposed embryos taken at high resolution. E, Representative images from 2.5 dpf Tg(cntn1b:EGFP-CAAX) controls and DomA-exposed embryos used for tracing studies. Green arrow points to motor neuron axons that were traced to estimate primary motor neuron axonal lengths in each treatment. Tracings are false-colored. The main primary motor neuron axon was traced in green, and the axon collaterals were traced with magenta. F, Quantification of total lengths from axonal tracings of a subset of the imaged fish (inclusive of the main motor neuron in green and axon collaterals in magenta). Each point represents a single axon in one fish (control n = 43, DomA n = 45). Statistical significance was determined using Welch’s analysis of variance (ANOVA) ***p < 0.0001. Scale bar for Figs. 8B, 8D, and 8E = 100μm. Scale bar for Fig. 8C = 50 μm.. Abbreviations: PLL, peripheral lateral line; CaP, caudal primary motor neurons.

Similar articles

Cited by

References

    1. Almeida R. G., Czopka T., Ffrench-Constant C., Lyons D. A. (2011). Individual axons regulate the myelinating potential of single oligodendrocytes in vivo. Development 138, 4443–4450. - PMC - PubMed
    1. Anderson D. M., Glibert P. M., Burkholder J. M. (2002). Harmful algal blooms and eutrophication: Nutrient sources, composition, and consequences. Estuaries 25, 704–726.
    1. Bates, D., Mächler, M., Bolker, B., and Walker, S. (2015). Fitting Linear Mixed-Effects Models using lme4. J. Stat. Softw. 67, 1–48.
    1. Bates S. S., Hubbard K. A., Lundholm N., Montresor M., Leaw C. P. (2018). Pseudo-nitzschia, Nitzschia, and domoic acid: New research since 2011. Harmful Algae 79, 3–43. - PubMed
    1. Benaglia T., Chauveau, D., Hunter, D., and Young, D. (2009). mixtools: An R package for analyzing finite mixture models. J. Stat. Softw. 32, 1–29.

Publication types