. 2021 Dec 6;13(9):646-661.
doi: 10.1093/jmcb/mjab034.

Sequential activation of uterine epithelial IGF1R by stromal IGF1 and embryonic IGF2 directs normal uterine preparation for embryo implantation

Affiliations

Sequential activation of uterine epithelial IGF1R by stromal IGF1 and embryonic IGF2 directs normal uterine preparation for embryo implantation

Chan Zhou et al. J Mol Cell Biol. .

Abstract

Embryo implantation in both humans and rodents is initiated by the attachment of a blastocyst to the uterine epithelium. For blastocyst attachment, the uterine epithelium needs to transform at both the structural and molecular levels first, and then initiate the interaction with trophectoderm. Any perturbation during this process will result in implantation failure or long-term adverse pregnancy outcomes. Endocrine steroid hormones, which function through nuclear receptors, combine with the local molecules produced by the uteri or embryo to facilitate implantation. The insulin-like growth factor (IGF) signaling has been reported to play a vital role during pregnancy. However, its physiological function during implantation remains elusive. This study revealed that mice with conditional deletion of Igf1r gene in uteri suffered from subfertility, mainly due to the disturbed uterine receptivity and abnormal embryo implantation. Mechanistically, we uncovered that in response to the nidatory estrogen on D4 of pregnancy, the epithelial IGF1R, stimulated by the stromal cell-produced IGF1, facilitated epithelial STAT3 activation to modulate the epithelial depolarity. Furthermore, embryonic derived IGF2 could activate both the epithelial ERK1/2 and STAT3 signaling through IGF1R, which was critical for the transcription of Cox2 and normal attachment reaction. In brief, our data revealed that epithelial IGF1R was sequentially activated by the uterine stromal IGF1 and embryonic IGF2 to guarantee normal epithelium differentiation during the implantation process.

Keywords: IGF1; IGF1R; IGF2; blastocyst; implantation; uterine epithelium.


Figures

Figure 1
Figure 1
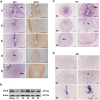
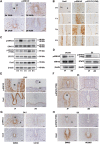
Spatiotemporal expression of IGF signaling components in mouse uteri during peri-implantation. (A) ISH (left) and IHC (right) of IGF1R in D1‒D8 uteri. Scale bar, 200 μm. (B) Western blotting analysis of IGF1R in uteri from D1 to D8. β-actin serves as a loading control. (C and D) ISH of Igf1 and Igf2 mRNA in the uteri during early pregnancy. Scale bar, 100 μm. Bl, blastocyst; Le, luminal epithelium; Ge, glandular epithelium; S, stroma; Em, embryo; Myo, myometrium.
Figure 2
Figure 2
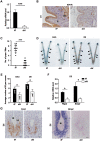
Uterine IGF1R is indispensable for embryo implantation. (A) qPCR analysis for IGF1R mRNA level in Igf1rf/f and Igf1rd/d uteri on D1. ***P < 0.001. (B) IHC of IGF1R in uteri on D1. Scale bar, 100 μm. (C) Average litter sizes in Igf1rf/f and Igf1rd/d females. ***P < 0.001. (D) The gross morphology of implantation sites in Igf1rf/f and Igf1rd/d mice visualized by blue dye reaction. Black arrowheads indicate the implantation sites. (E) Average number of implantation sites (IS) in Igf1rf/f and Igf1rd/d mice. *P < 0.05. (F) Relative mRNA levels of marker genes in Igf1rf/f and Igf1rd/d uteri on D5. The values are normalized to Gapdh and indicated as mean ± SEM, n = 3. *P < 0.05. (G) IHC of Cox2 in D5 uteri with the blastocyst. Scale bar, 50 μm. (H) ISH of Bmp2 mRNA in D5 uteri. Scale bar, 50 μm. Le, luminal epithelium; Ge, glandular epithelium; S, stroma; Bl, blastocyst.
Figure 3
Figure 3
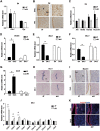
Epithelial differentiation in Igf1rd/d uteri is defective in response to nidatory estrogen. (A) Relative mRNA levels of uterine Esr1 and Pgr in Igf1rf/f and Igf1rd/d mice on D4. The values are normalized to Gapdh and indicated as mean ± SEM, n = 3. (B) IHC staining of ERα and PR in D4 Igf1rf/f and Igf1rd/d uteri. Scale bar, 100 μm. (C) Relative mRNA expression of P4 downstream genes in D4 Igf1rf/f and Igf1rd/d uteri. The values are normalized to Gapdh and indicated as mean ± SEM, n = 3. (DG) Relative mRNA levels for estrogen target genes in Igf1rf/f and Igf1rd/d uteri in D4 morning and evening. *P < 0.5. (H) ISH of Msx1 in Igf1rf/f and Igf1rd/d uteri in D4 morning and evening. Scale bar, 200 μm. (I) IHC of Mucin1 in D4 morning and evening. Scale bar, 100 μm. (J) qPCR analysis for mRNA levels of adherent junctional and tight junctional members in D4.5 uteri. *P < 0.05. (K) Immunofluorescence analysis of uterine CLDN1 (red) expression at the indicated time. Nuclei were stained with DAPI (blue). Scale bar, 100 μm. Le, luminal epithelium; Ge, glandular epithelium; S, stroma; Bl, blastocyst.
Figure 4
Figure 4
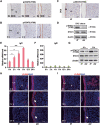
Nidatory estrogen-induced IGF1 activates the STAT3 pathway to regulate the epithelial transformation. (A) IHC of uterine p-STAT3 (Y705) in different time points on D4. Scale bar, 100 μm. (B) Immunostaining of uterine p-STAT3 (Y705) in response to E2 treatment after ovariectomy on D3. Scale bar, 50 μm. (C) Immunostaining of uterine p-STAT3 (Y705) in Igf1rf/f and Igf1rd/d mice on D4.5. Scale bar, 100 μm. (D) Western blotting analysis for p-STAT3 (Y705) and total STAT3 in D4.5 uteri. (E and F) qPCR analysis for Igf1 and Igf2 mRNA expression in WT mouse uteri in response to E2 treatment after ovariectomy on D3. The values are normalized to gapdh and indicated as mean ± SEM, n = 3. (G) Western blotting analysis for expression levels of p-STAT3 (Y705) and STAT3 proteins in Igf1rf/f and Igf1rd/d mouse uteri in response to E2 treatment. (H and I) Immunostaining of CLDN1 (red) and CLDN7 (red) in Igf1rf/f and Igf1rd/d uteri. Nuclei were stained with DAPI (blue). Scale bar, 50 μm. White arrow indicates the sustained location in Igf1rd/d uteri. Le, luminal epithelium; S, stroma; Ge, glandular epithelium; Bl, blastocyst.
Figure 5
Figure 5
Embryo-derived IGF2 facilitates embryo implantation. (A) qPCR analysis for Igf1 and Igf2 mRNA expression in the blastocysts in D4 morning and evening. The values are normalized to Gapdh and indicated as mean ± SEM, n = 3. *P < 0.05. (B) Immunofluorescence analysis for IGF2 localization in the blastocysts in D4 morning and evening. Scale bar, 40 μm. (C) Blue dye reaction to detect the implantation status of blastocysts with different treatments. Black arrowheads indicate the implantation sites. (D) Average number of implantation sites (IS) in control and IGF2-specific antibody-blocked groups. ***P < 0.001. (E) Immunostaining of Cox2 in uterine sections of implantation sites from control and blocking antibody-treated groups. Scale bar, 100 μm. (F) Morphology of uteri with transferred beads coated with BSA or IGF2 recombinase protein. The implantation-like sites were visualized by blue dye reaction at 24 h after the transfer. Black arrowheads indicate the implantation-like sites induced by IGF2-coated beads. (G) Immunostaining of uterine Cox2 induced by IGF2-coated beads or BSA-treated beads. Black arrow points the Cox2 signaling in the epithelium. Scale bar, 50 μm. ICM, inner cell mass; Te, trophectoderm; Bl, blastocyst; Be, beads.
Figure 6
Figure 6
IGF2‒IGF1R signaling-induced Cox2 expression requires both ERK1/2 and STAT3 activation. (A) IHC of uterine p-ERK1/2 protein at indicated time points from D4 to D5 of pregnancy. Scale bar, 100 μm. (B) Immunostaining of Cox2, p-ERK1/2, and p-STAT3 (Y705) in the uteri after IGF2 recombinase protein treatment. Scale bar, 100 μm. (C) Western blotting analysis for different proteins with the lysates of epithelial cells of WT mice in response to E2 treatment. (D) Western blotting for D4.5 uterine lysates utilizing pERK1/2, ERK1/2, p-STAT3 (Y705), and STAT3 antibodies. (E) Immunostaining of uterine p-ERK1/2 and Cox2 in Igf1rf/f and Igf1rd/d mice on D4.5. Scale bar, 200 μm. (F) Immunostaining of p-STAT3 (Y705) in Igf1rf/f and Igf1rd/d uteri on D5. Scale bar, 200 μm. (G) Immunostaining of p-ERK1/2 and Cox2 in the uteri from both control and U0126-treated mice on D4.5. U0126, a MEK inhibitor, was intraperitoneally injected at 18:00 on D4. Scale bar, 100 μm. (H) Immunostaining of p-STAT3 (Y705) and Cox2 in the uteri on D5 from both control and U0126-treated mice. Scale bar, 100 μm. Le, luminal epithelium; Bl, blastocyst; S, stroma.
Figure 7
Figure 7
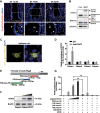
STAT3 and ERK1/2 synergistically regulate Cox2 expression. (A) Fluorescence images of Duolink in situ PLA using rabbit anti-ERK1/2 antibody and mouse anti-STAT3 antibody at the indicted time on D4. White arrowheads indicate multiple positive PLA signals (red spots). White arrow points noisy signal. The nuclei were labeled with DAPI (blue). Scale bar, 200 μm. Le, luminal epithelium; B, blastocyst. (B) Western blotting analysis for the expression of BiFC constructs. GAPDH served as the loading control. (C) BiFC assays to evaluate interactions between ERK1 and STAT3. Images were acquired 36 h after transfection. Scale bar, 5 μm. (D) ChIP‒qPCR analysis for the enrichment of STAT3 in the Cox2 promoter. IgG was used as control. *P < 0.05. (E) Schematic illustration of luciferase reporter constructs with different inserts. (F) Western blotting analysis for STAT3 in 293T cells transfected with increasing amounts of STAT3-expressing constructs. (G) Dual-luciferase reporter assay utilizing the Cox2 promoter-driven reporter combined with different plasmids. The compound inS3-54A18, an inhibitor for DNA-binding activity of STAT3, was used at 10 μM. U0126 was used at 10 μM to inhibit the activation of ERK1/2. After 36 h of culture, cell lysates were assayed for firefly and Renilla luciferase activity. The data are expressed as fold induction of luciferase activity relative to the promoter alone, and data presented are the mean of three independent experiments performed in duplicate. **P < 0.01.
Figure 8
Figure 8
A diagram displays the sequential role of IGF1R signaling during the implantation. Nidatory estrogen peak at D4 morning induces the expression of stromal IGF1, which is involved in activating the epithelial STAT3 via a paracrine manner for depolarizing the uterine epithelium. On D4.5, the upregulated IGF2 from the late blastocyst acts on epithelial cells, synergistically activating both the ERK1/2 and STAT3 signaling to induce Cox2 expression for attachment.

Similar articles

Cited by

References

    1. Auernhammer C.J., Melmed S. (2000). Leukemia-inhibitory factor—neuroimmune modulator of endocrine function. Endocr. Rev. 21, 313–345. - PubMed
    1. Baumgarten S.C., Armouti M., Ko C., et al. (2017). IGF1R expression in ovarian granulosa cells is essential for steroidogenesis, follicle survival, and fertility in female mice. Endocrinology 158, 2309–2318. - PMC - PubMed
    1. Cha J., Sun X., Bartos A., et al. (2013). A new role for muscle segment homeobox genes in mammalian embryonic diapause. Open Biol. 3, 130035. - PMC - PubMed
    1. Chen J.R., Cheng J.G., Shatzer T., et al. (2000). Leukemia inhibitory factor can substitute for nidatory estrogen and is essential to inducing a receptive uterus for implantation but is not essential for subsequent embryogenesis. Endocrinology 141, 4365–4372. - PubMed
    1. Constância M., Hemberger M., Hughes J., et al. (2002). Placental-specific IGF-II is a major modulator of placental and fetal growth. Nature 417, 945–948. - PubMed

Publication types