. 2021 Sep 27;38(10):4616-4627.
doi: 10.1093/molbev/msab168.

Finding Hybrid Incompatibilities Using Genome Sequences from Hybrid Populations

Affiliations

Finding Hybrid Incompatibilities Using Genome Sequences from Hybrid Populations

Alexandre Blanckaert et al. Mol Biol Evol. .

Abstract

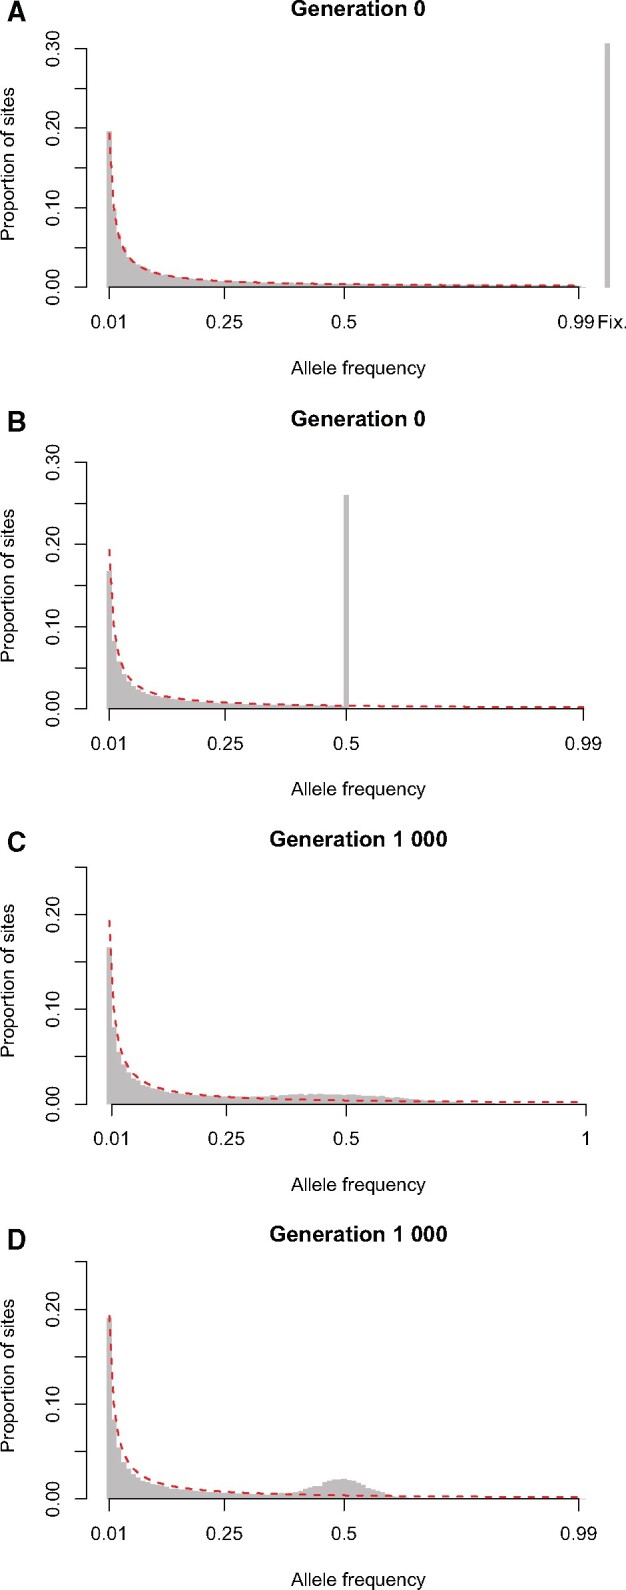
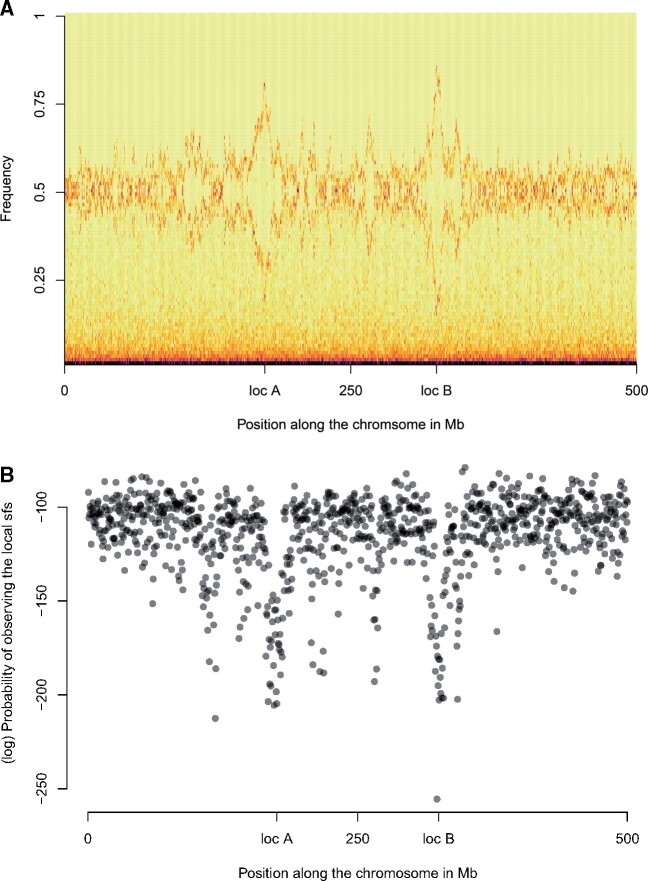
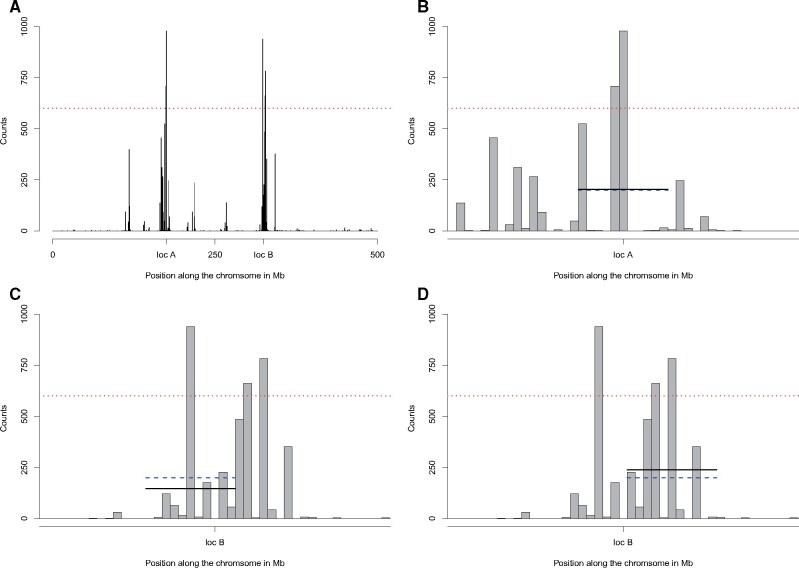
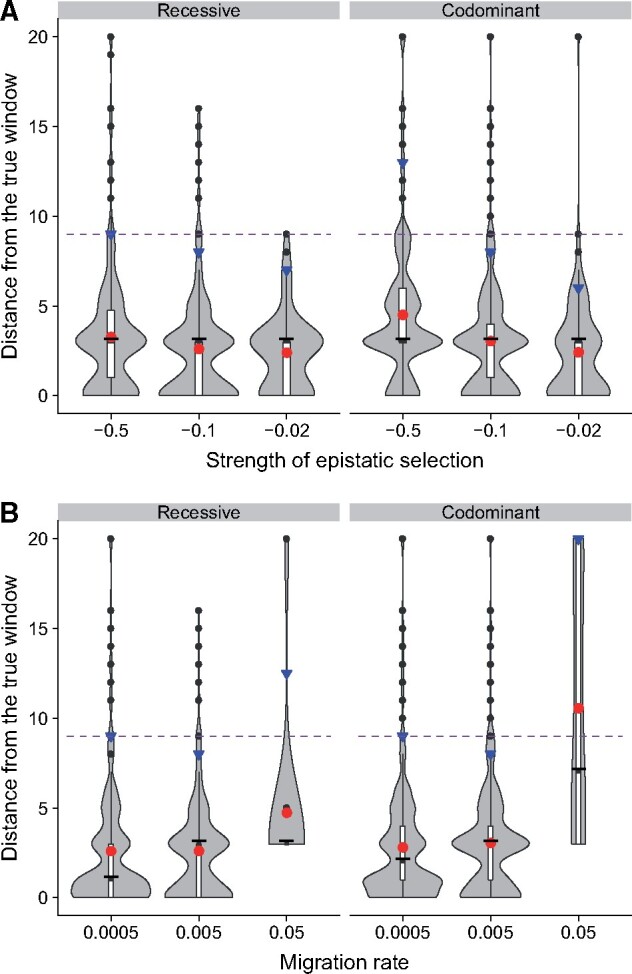
Natural hybrid zones offer a powerful framework for understanding the genetic basis of speciation in progress because ongoing hybridization continually creates unfavorable gene combinations. Evidence indicates that postzygotic reproductive isolation is often caused by epistatic interactions between mutations in different genes that evolved independently of one another (hybrid incompatibilities). We examined the potential to detect epistatic selection against incompatibilities from genome sequence data using the site frequency spectrum (SFS) of polymorphisms by conducting individual-based simulations in SLiM. We found that the genome-wide SFS in hybrid populations assumes a diagnostic shape, with the continual input of fixed differences between source populations via migration inducing a mass at intermediate allele frequency. Epistatic selection locally distorts the SFS as non-incompatibility alleles rise in frequency in a manner analogous to a selective sweep. Building on these results, we present a statistical method to identify genomic regions containing incompatibility loci that locates departures in the local SFS compared with the genome-wide SFS. Cross-validation studies demonstrate that our method detects recessive and codominant incompatibilities across a range of scenarios varying in the strength of epistatic selection, migration rate, and hybrid zone age. Our approach takes advantage of whole genome sequence data, does not require knowledge of demographic history, and can be applied to any pair of nascent species that forms a hybrid zone.

Keywords: epistasis; genetic incompatibilities; hybrid zone; site frequency spectrum.


Figures

Fig. 1.
Fig. 1.
Neutral SFS in a hybrid zone. The neutral expectation of an isolated population is given in red and proportional to 1/f (Wright 1938). (A) SFS for the parental population at the time of formation of the hybrid population. The relative proportion of fixed mutations (#fixed/#polymorphic) has been added to the right. (B) Predicted SFS for the hybrid population at generation 0. (C) SFS for an isolated hybrid population at generation 1,000. (D) SFS for a sink hybrid population at generation 1,000 (m =0.005). SFS for both the isolated hybrid populations and the sink hybrid population at different time points (100, 5,000 and 10,000) can be found in supplementary figure S1, Supplementary Material online.
Fig. 2.
Fig. 2.
(A) Local SFS calculated over regions of 500 kb. The X-axis corresponds to the position along the chromosome, the Y-axis shows SNP allele frequency. The density is indicated by color, with yellow denoting a lack of SNPs with the corresponding frequency and black denoting an abundance of SNPs with that frequency. (B) Probability of observing the local SFS conditional on the global SFS. Results are shown for simulations with s=0,ϵ=-0.1,m=0.005,gen.=1,000.
Fig. 3.
Fig. 3.
Outcome of bootstrap analysis and definition of thresholds. (A) Number of times each window was in the lower 1% tail for the probability of the local SFS being observed given the global SFS in the analysis with 1,000 bootstrap replicates. The red dotted line indicates the first threshold, thr1. In this example, there are five windows that satisfy this first criterion. (B) Zoom-in on the two outlier windows detected close to locus A. The blue dashed line indicates the second threshold thr2 and the black line indicates the average number of times a window appears in the lower 1% tail. Both the blue line and the black line are drawn only over the windows of interest, that is, including d =5 windows to the left and five windows to the right of the focal window. (C, D) Zoom-in on two outlier windows detected close to locus B. The bootstrap analysis depicted in this figure used the same set of data presented in figure 2.
Fig. 4.
Fig. 4.
Distribution of distances between the detected outliers and the incompatible loci. Outliers were determined using the following filters {d=9,thr1=900,thr2=80}. For both panels, points found more than 20 windows away (10 Mb) were removed, as they are unlikely to reflect selection. Mean distance is given by the red circle, median by the thick black line and the 95th percentile by the blue triangle. The purple dashed line corresponds to d =9 and separate “true positive” from “false positive.” (A) Distance between the detected outliers and the incompatibility loci for different strengths of the incompatibility with the default migration rate, m =0.005. (B) Distance between the detected outliers and the incompatibility loci for different migration rate with the default epistasis coefficient, ϵ=-0.1.

Similar articles

Cited by

References

    1. Bank C, Bürger R, Hermisson J.. 2012. The limits to parapatric speciation: Dobzhansky–Muller incompatibilities in a continent–island model. Genetics 191(3):845–863. - PMC - PubMed
    1. Barton N, Bengtsson B.. 1986. The barrier to genetic exchange between hybridising populations. Heredity 57(3):357–376. - PubMed
    1. Barton N, Hewitt G.. 1985. Analysis of hybrid zones. Annu Rev Ecol Syst. 16(1):113–148.
    1. Bateson W.1909. Heredity and variation in modern lights. In: Seward AC, editor. Darwin and Modern Science. Cambridge: Cambridge University Press. p. 85–101.
    1. Beissinger T, Gholami M, Erbe M, Weigend S, Weigend A, De Leon N, Gianola D, Simianer H.. 2016. Using the variability of linkage disequilibrium between subpopulations to infer sweeps and epistatic selection in a diverse panel of chickens. Heredity 116(2):158–166. - PMC - PubMed

Publication types